Fig. 1
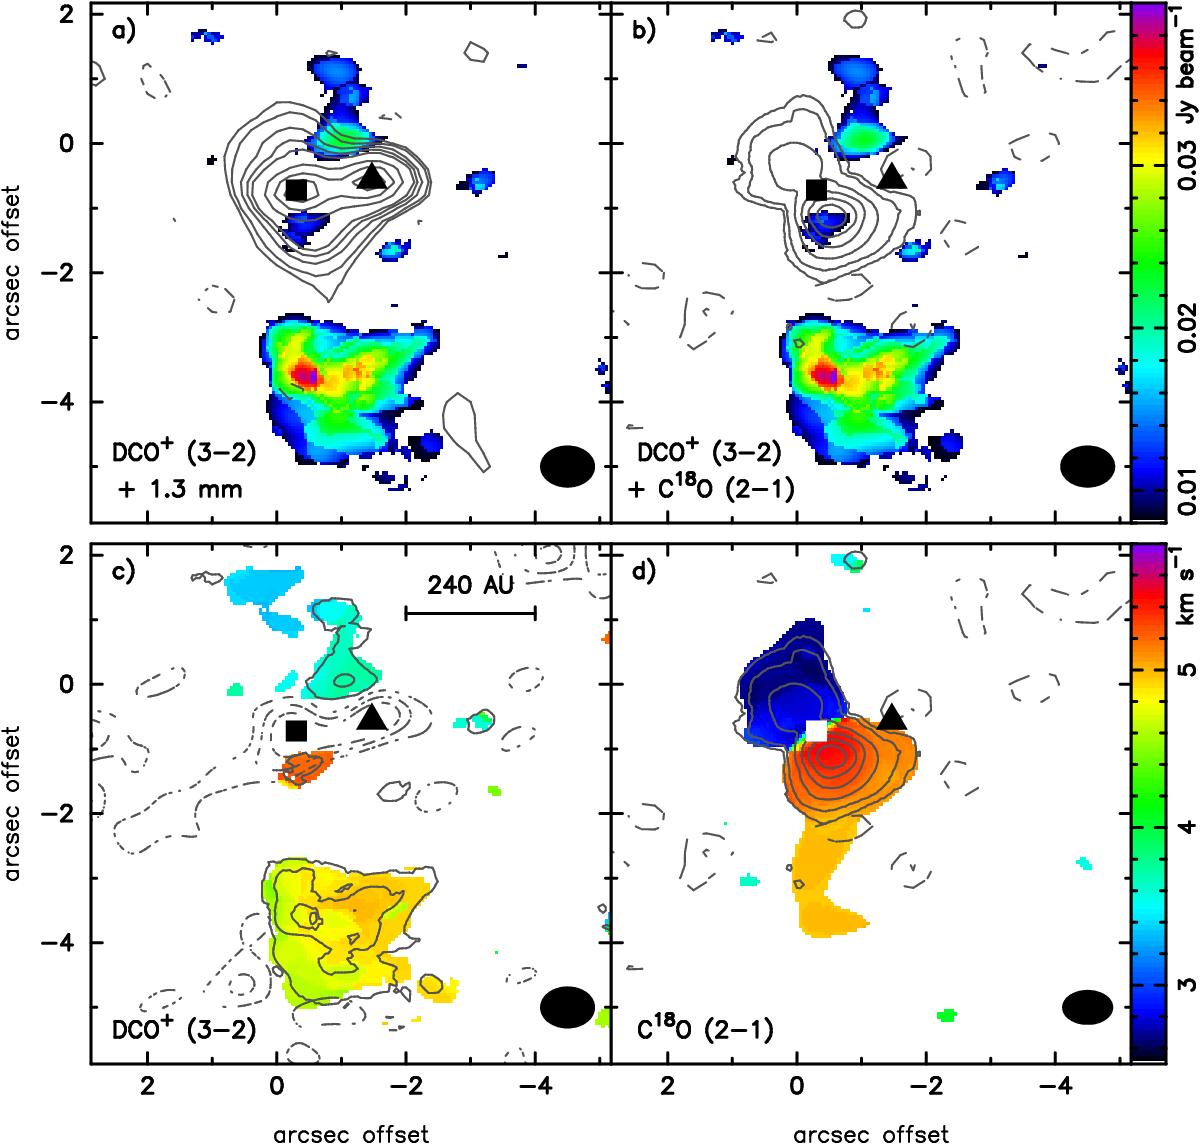
DCO+ compared with continuum and C18O toward VLA1623A and B, marked with a square and triangle, respectively. The black ellipse shows the synthesized beam. Intensity integrated DCO+ (color-scale) with a) 1.3 mm continuum and b) C18O. DCO+ peaks at 0.0433 Jy beam-1 km s-1. Contours are in steps of 3, 5, 10, 15, 20, 40, 60 and 78σ with σ = 1 mJy beam-1 for 1.3 mm continuum, and −5, −3, 3, 5, 10, 15, 20 and 25σ with σ = 13 mJy beam-1 km s-1 for C18O. Velocity map (moment 1, color-scale) for c) DCO+ and d) C18O overlaid with the corresponding intensity integrated map (contours). Contours are in steps of −10, −7, −4, 4, 7, 10 and 11σ with σ = 3 mJy beam-1 km s-1 for DCO+, and the same as in b) for C18O.
Current usage metrics show cumulative count of Article Views (full-text article views including HTML views, PDF and ePub downloads, according to the available data) and Abstracts Views on Vision4Press platform.
Data correspond to usage on the plateform after 2015. The current usage metrics is available 48-96 hours after online publication and is updated daily on week days.
Initial download of the metrics may take a while.