Fig. 9
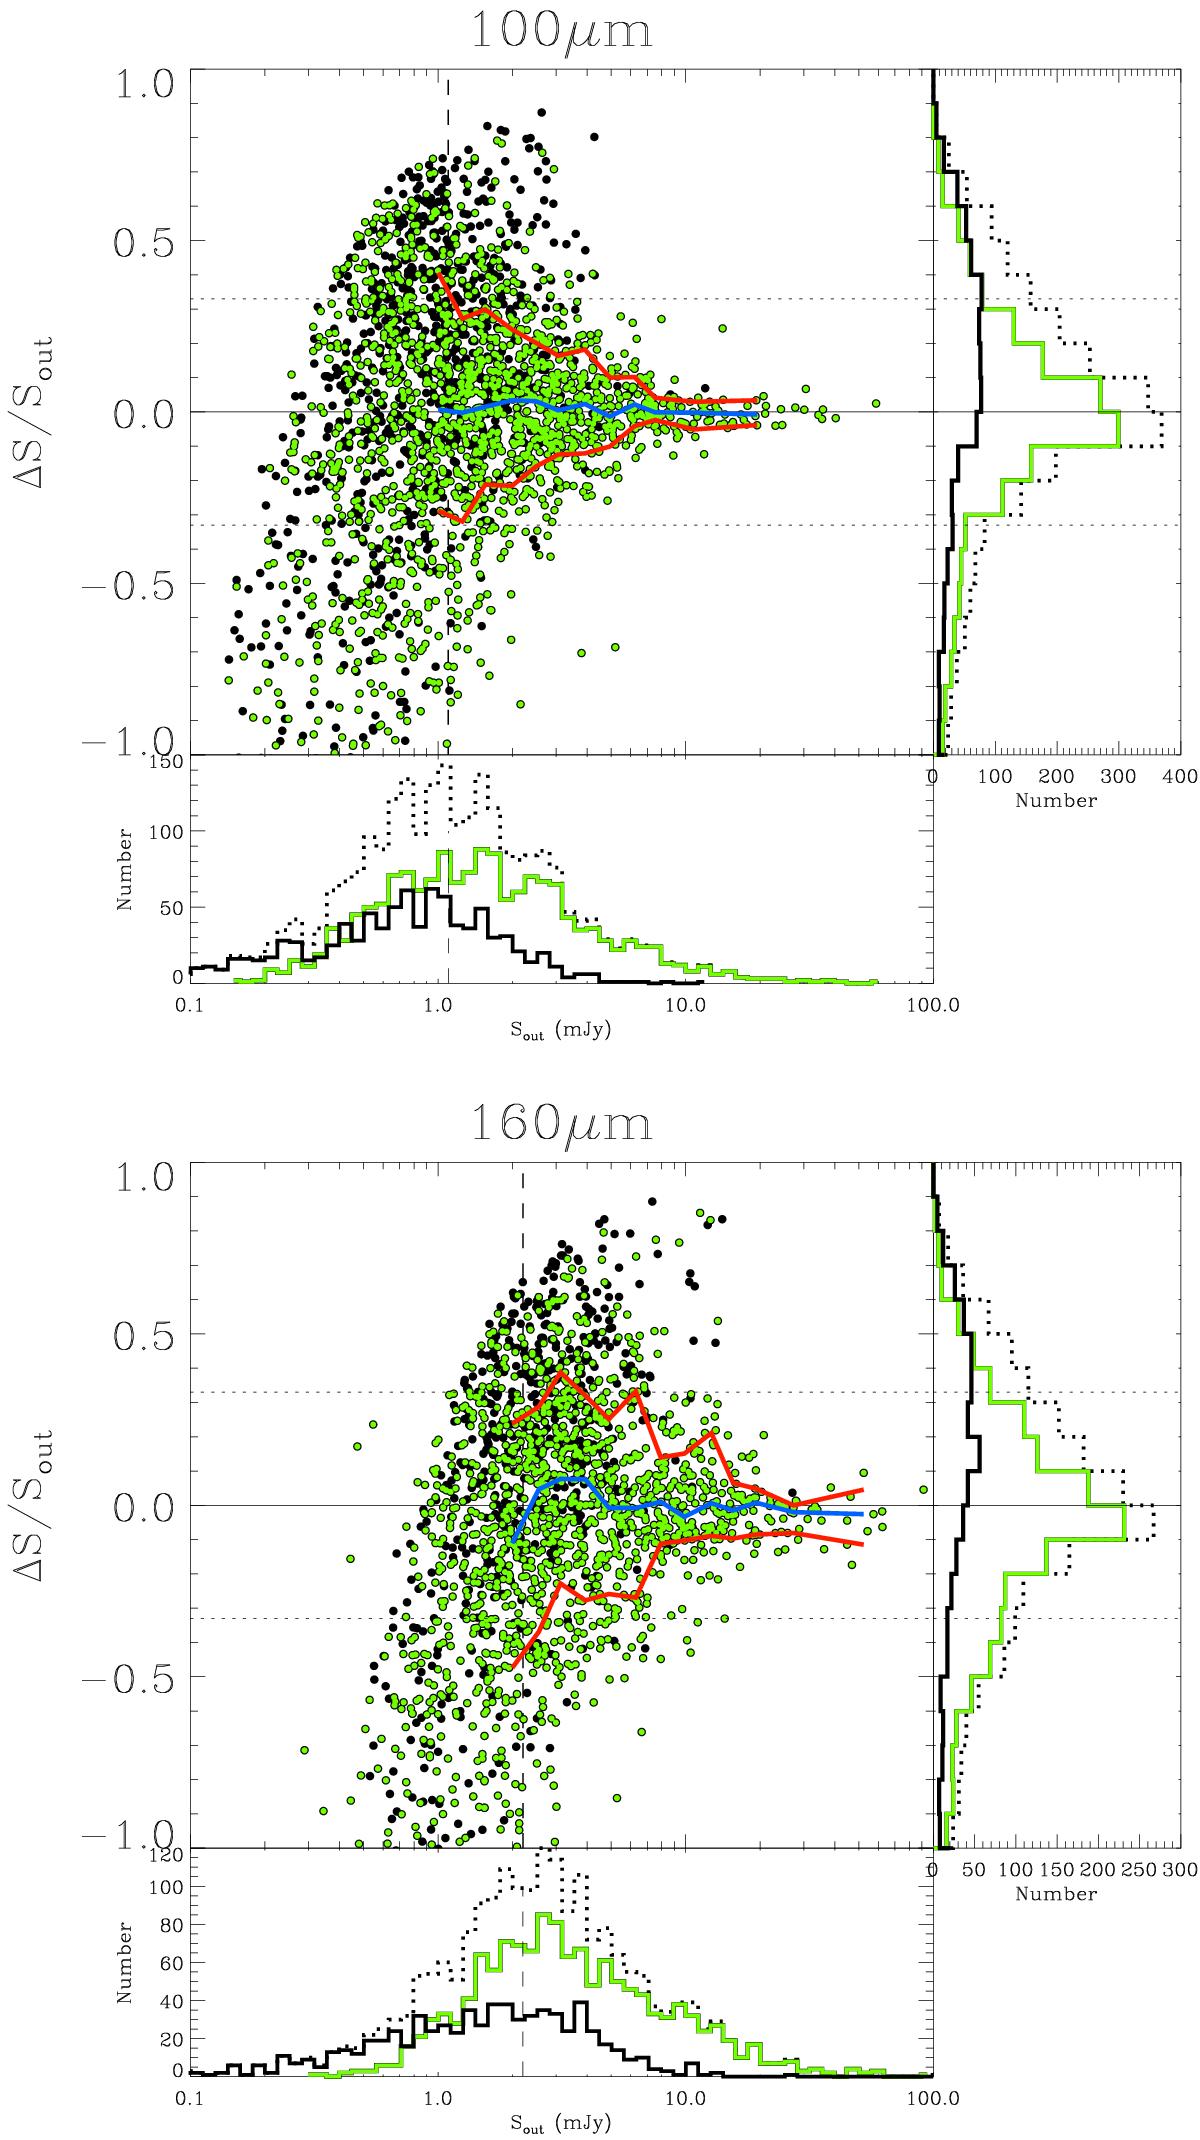
Photometric accuracy index, ΔS/Sout= (Sout−Sin) /Sout, as a function of the output flux Sout. The median trend of | ΔS | /Sout is shown by the blue line and the red envelope lines contains the 68% of the clean galaxies, i.e. sources associated with a 24 μm source having a CI ≤ 1 (green dots). Dotted horizontal lines at | ΔS | /Sout=± 0.32 mark the limits that define sources having good photometry. The intersection between the 68% envelope line and the good photometry limit defines the depths for Herschel data based on the simulations (vertical dashed lines; 1.1 mJy, 2.2 mJy, 2.5 mJy, 5.0 mJy, and 9.0 mJy for the 100 μm, 160 μm, 250 μm, 350 μm, and 500 μm Herschel bands, respectively). The histograms on the bottom and right sides of each panel show the distribution of the whole sample of galaxies (dotted line), the clean galaxies (solid green line) and the complementary non-clean galaxies (solid black line) as a function of the flux density (horizontal histogram), and as a function of ΔS/Sout (vertical histogram). The comparison of the solid green and dotted lines shows that the proportion of clean sources remain identical in all flux density bins, i.e., there is no bias against faint or bright sources when dealing with clean sources alone.
Current usage metrics show cumulative count of Article Views (full-text article views including HTML views, PDF and ePub downloads, according to the available data) and Abstracts Views on Vision4Press platform.
Data correspond to usage on the plateform after 2015. The current usage metrics is available 48-96 hours after online publication and is updated daily on week days.
Initial download of the metrics may take a while.