Fig. 8
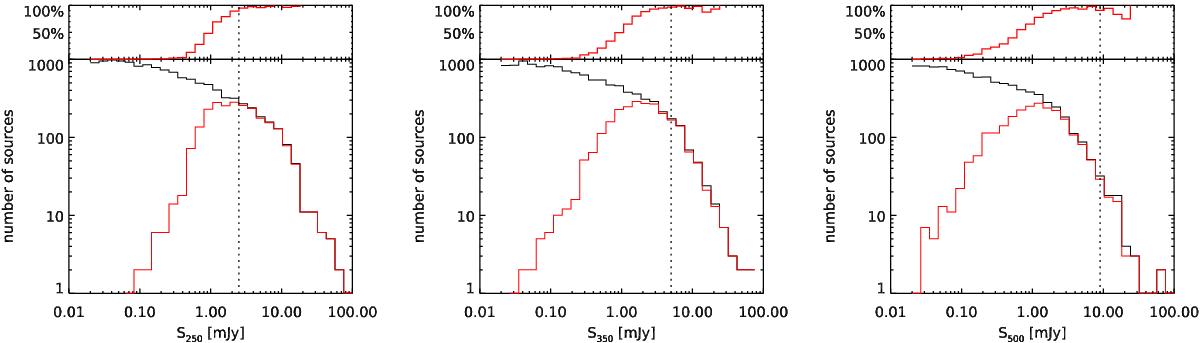
Number (lower panels) and fraction (upper panels) of 24 μm sources having a SPIRE counterpart (red) and those with no associated SPIRE detection as a function of the flux density in 250 μm (left panel), 350 μm (central panel), and 500 μm bands (right panel). Vertical lines show the flux limits reached using the simulations found in the present work 2.5 mJy for 250 μm 5.0 mJy for 350 μm, and 9.0 mJy for 500 μm. (See Sect. 7.1 for more details of how these flux limits were obtained.) Consequently, the missing 24 μm population at the flux limits of the simulations is very marginal.
Current usage metrics show cumulative count of Article Views (full-text article views including HTML views, PDF and ePub downloads, according to the available data) and Abstracts Views on Vision4Press platform.
Data correspond to usage on the plateform after 2015. The current usage metrics is available 48-96 hours after online publication and is updated daily on week days.
Initial download of the metrics may take a while.