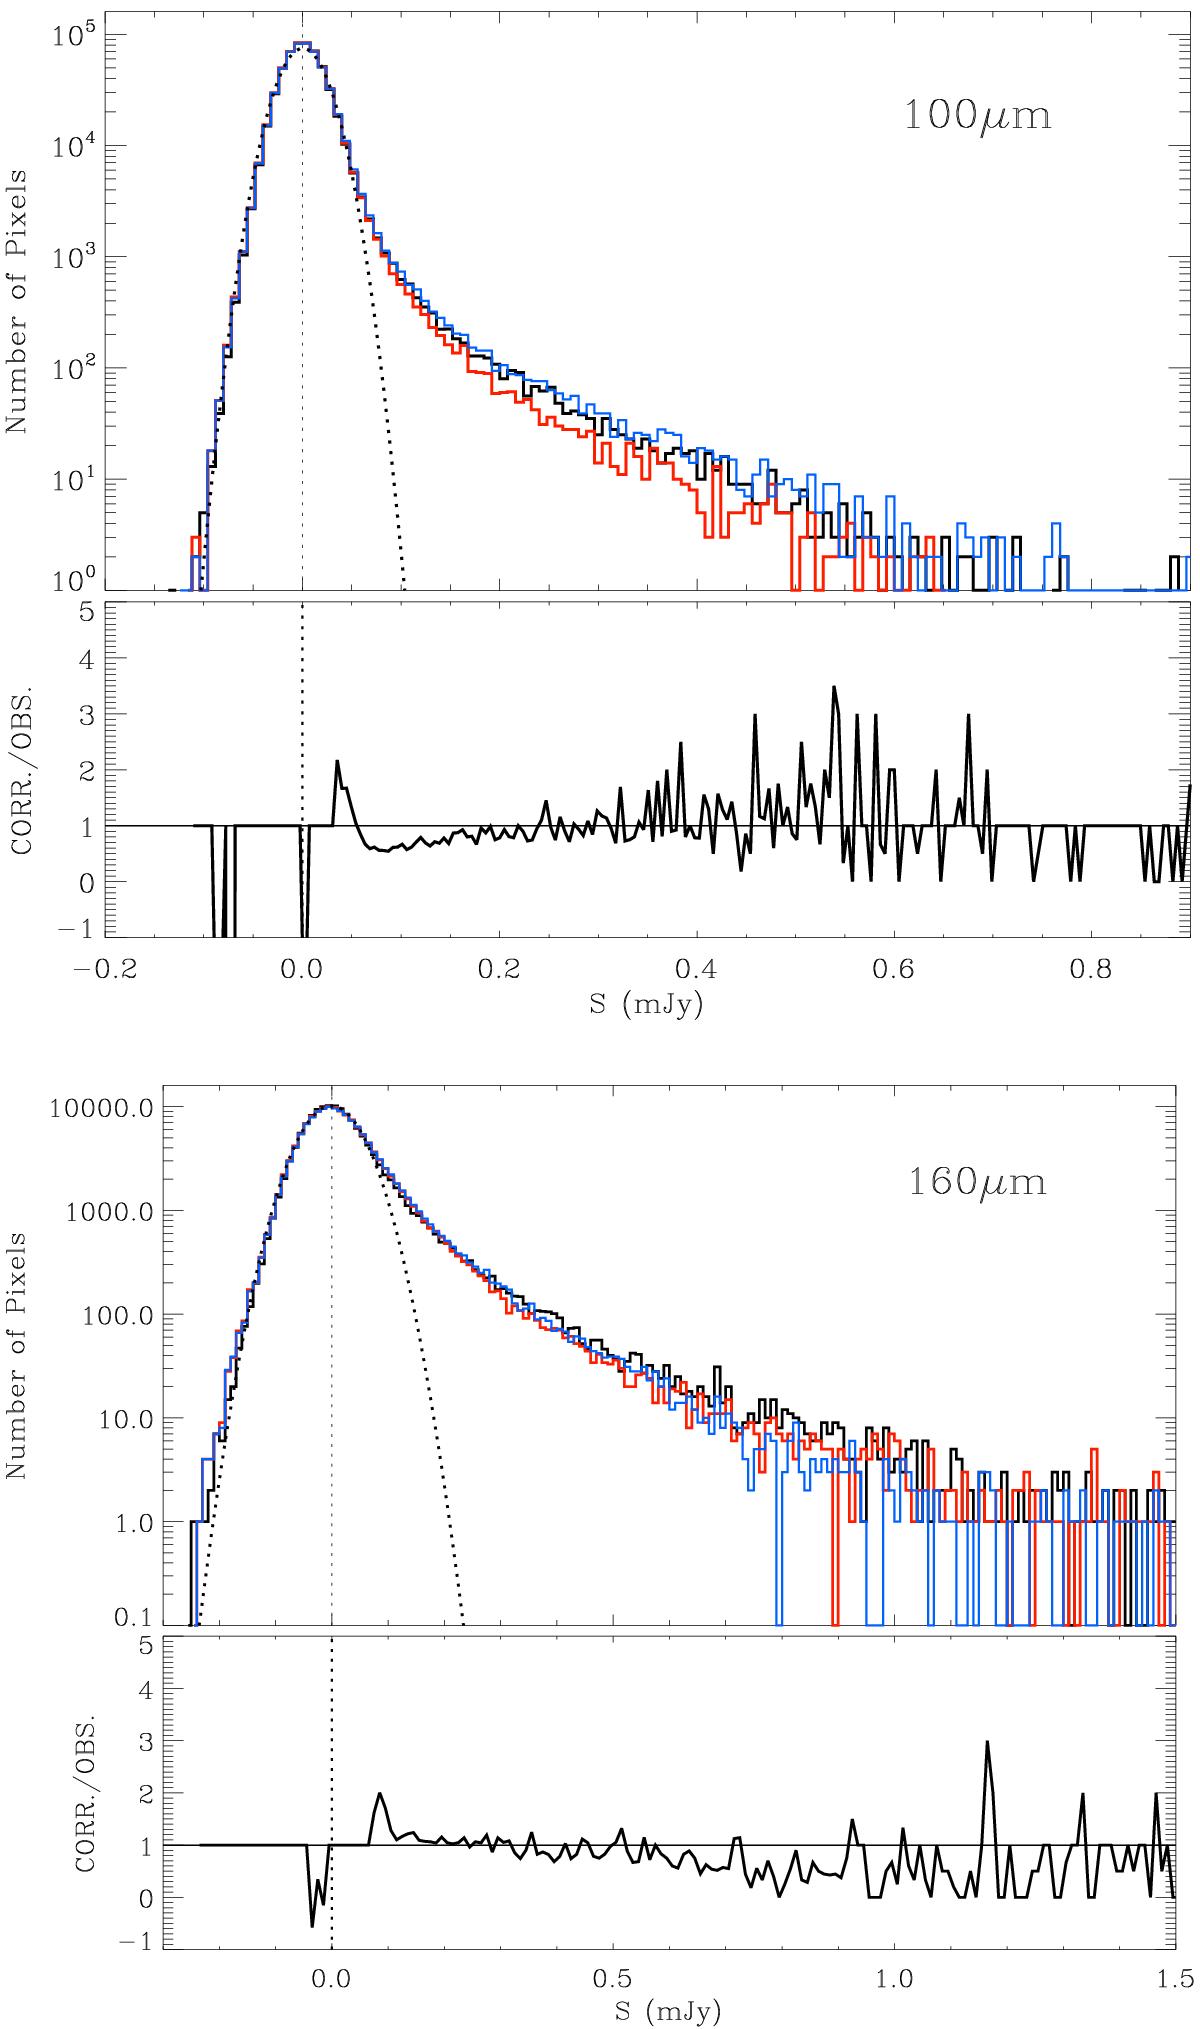
Fig. 5

Histogram of the flux distribution of pixels for Herschel maps and simulated mock images: observed (black), best-fit (red), and iteratively corrected (blue) fluxes. The corresponding pixel distribution of the noise maps used in the simulations are also presented (dashed lines). The panels below each histogram show residuals coming from ratio of the iteratively corrected map to the observed Herschel map after subtracting the instrumental noise as a function of the flux density. The ratio varies around 1 along the flux bins. The similarity between the observed and mock images is remarkable in particular in the flux bins where most of galaxies contributing to the CIRB are present (see Sect. 8).
Current usage metrics show cumulative count of Article Views (full-text article views including HTML views, PDF and ePub downloads, according to the available data) and Abstracts Views on Vision4Press platform.
Data correspond to usage on the plateform after 2015. The current usage metrics is available 48-96 hours after online publication and is updated daily on week days.
Initial download of the metrics may take a while.


