Fig. 3
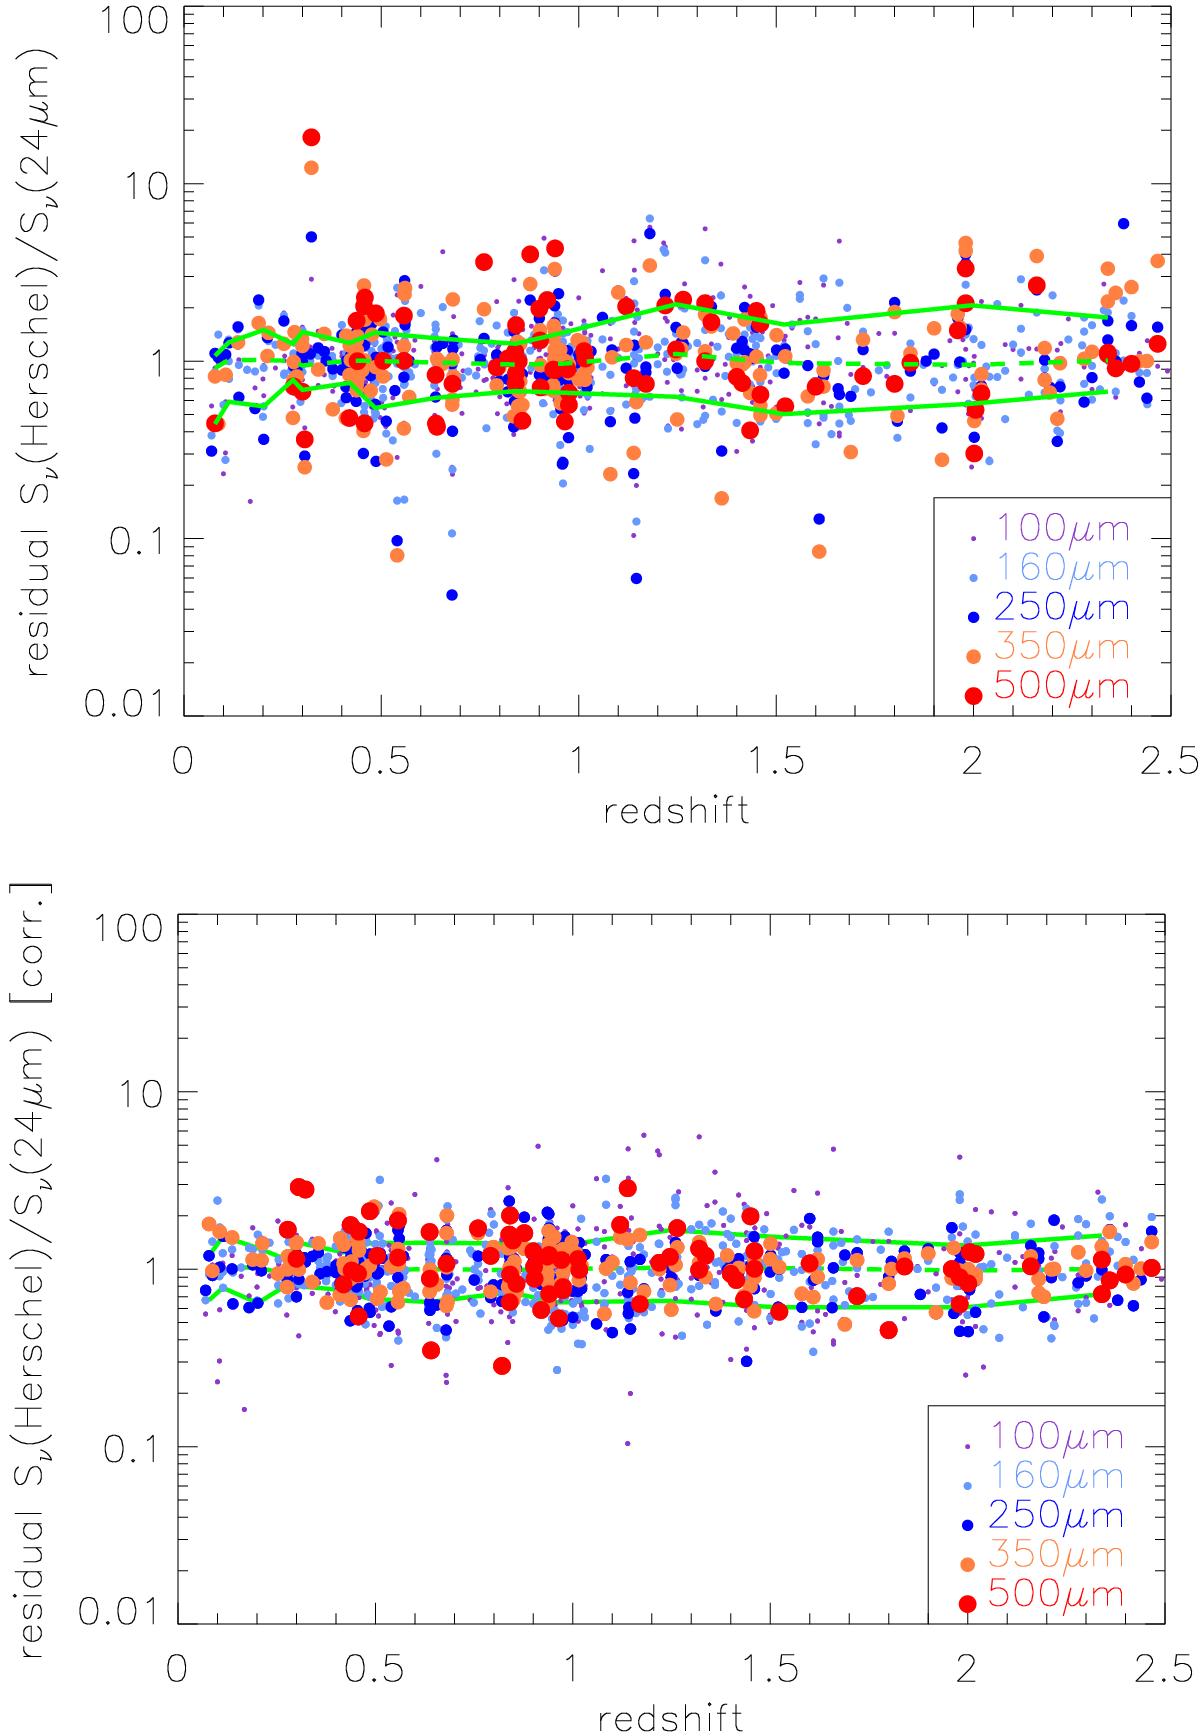
Residuals of colour index Herschel band minus MIPS-24 μm. with respect to the best-fit relations as a function of redshift. Upper panel: residuals for the observed colour index. The 68% dispersion around the median is equal to [0.17, 0.16, 0.18, 0.21, 0.31] dex for the five Herschel bandpasses when accounting for redshift ranges in the best-fit equations, while it would have been [0.20, 0.18, 0.20, 0.33, 0.42] without separating galaxies in redshift slices. Lower panel: dispersion after accounting for the offset measured at shorter wavelengths, e.g. correcting S160 μm/S24 μm by the distance of S100 μm/S24 μm to the median, the dispersion in colour indices becomes as small as [0.14, 0.12, 0.13, 0.19] at [160, 250, 350, 500] μm, respectively (no correction can be applied to the 100 μm band obviously). The correction process reduces the dispersion of the colour distribution because that variation is physical and not due to noise in the measurements.
Current usage metrics show cumulative count of Article Views (full-text article views including HTML views, PDF and ePub downloads, according to the available data) and Abstracts Views on Vision4Press platform.
Data correspond to usage on the plateform after 2015. The current usage metrics is available 48-96 hours after online publication and is updated daily on week days.
Initial download of the metrics may take a while.