Free Access
Fig. 2
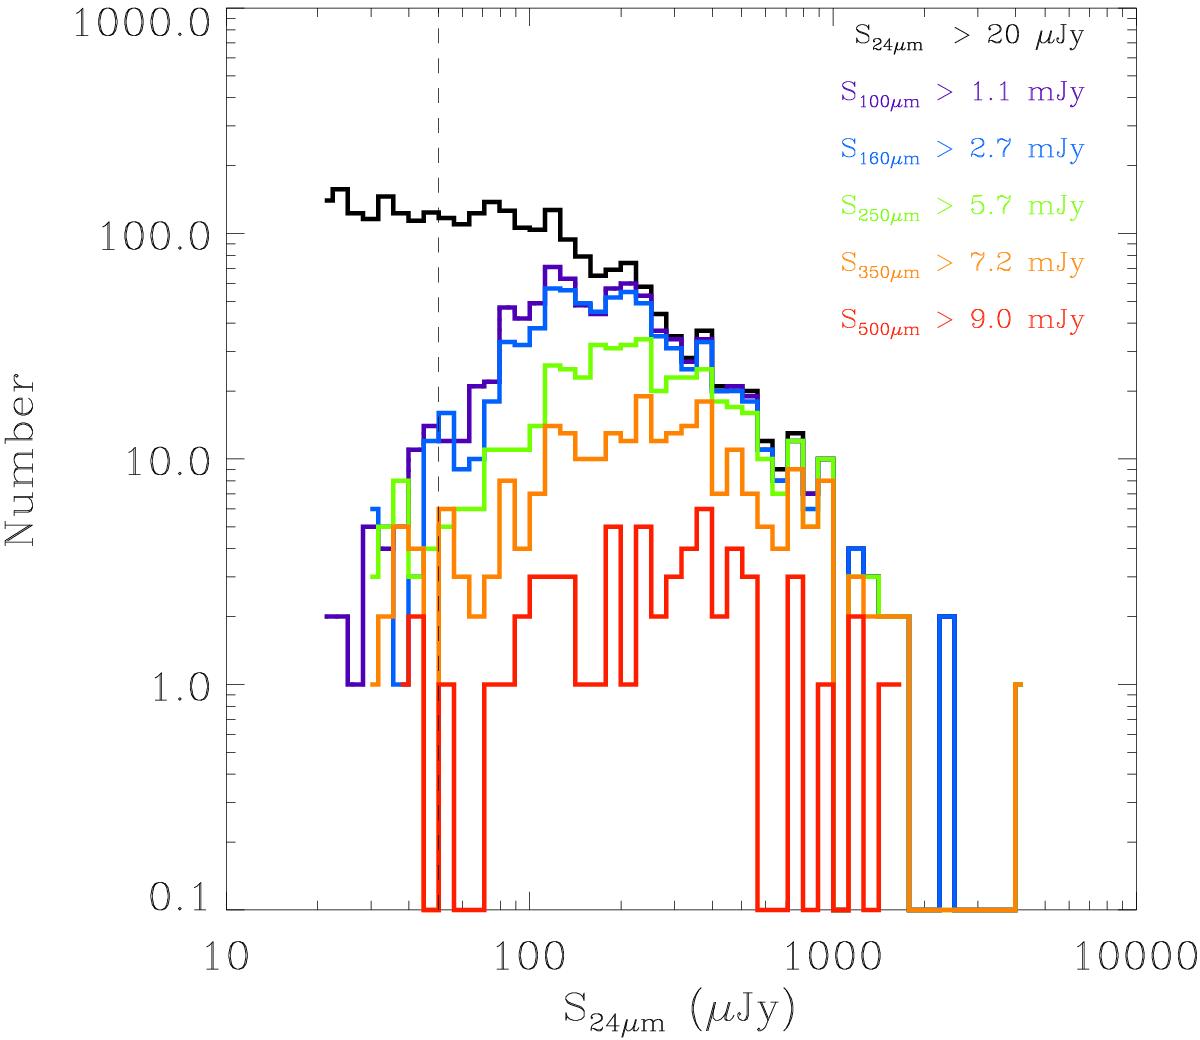
Histogram showing the number of 24 μm sources as a function of flux density in bins of 0.05 dex (black curve). The coloured lines show the number of 24 μm sources in the same flux density bins that are detected by Herschel at 100 to 500 μm.
Current usage metrics show cumulative count of Article Views (full-text article views including HTML views, PDF and ePub downloads, according to the available data) and Abstracts Views on Vision4Press platform.
Data correspond to usage on the plateform after 2015. The current usage metrics is available 48-96 hours after online publication and is updated daily on week days.
Initial download of the metrics may take a while.