Fig. 15
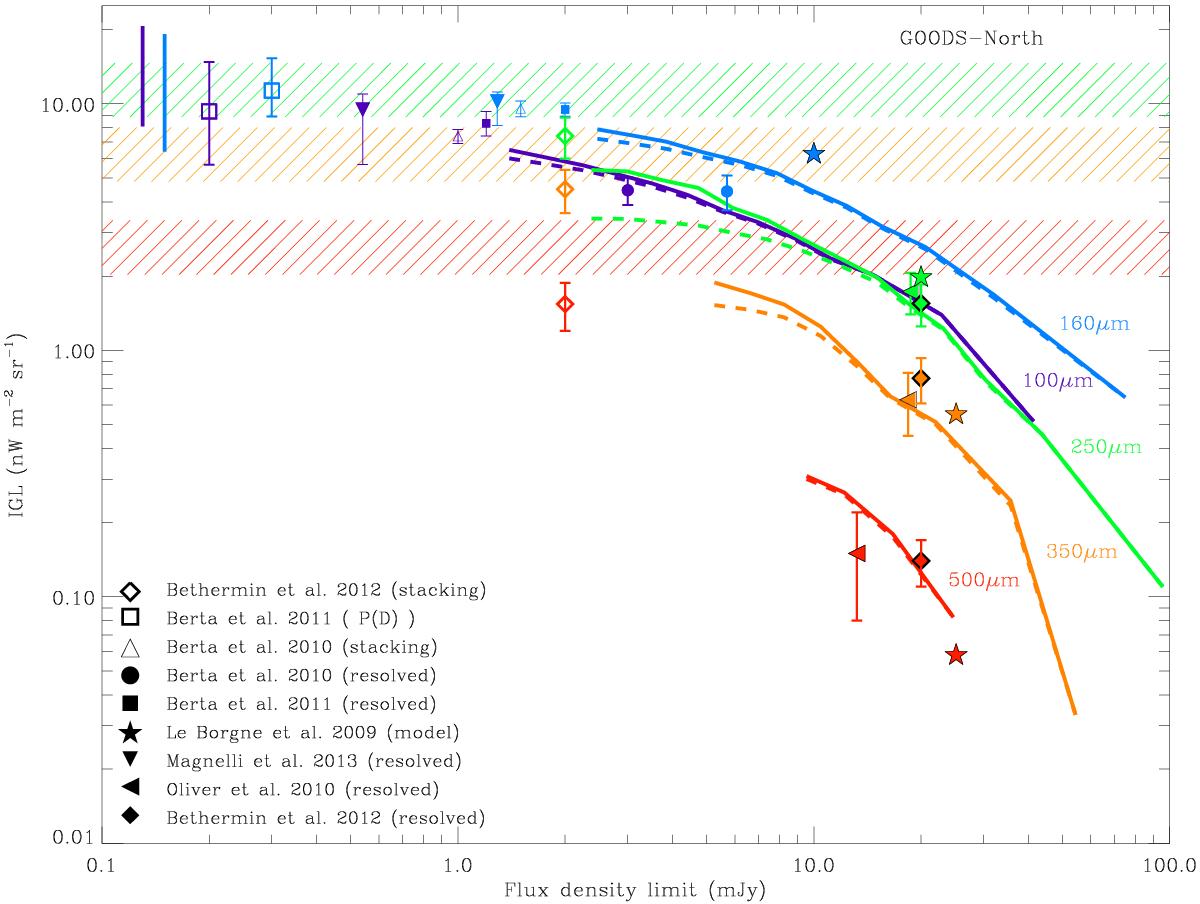
Cumulative contribution to the CIRB of the IGL as function of the flux density limit in 100 μm (violet), 160 μm (blue), 250 μm (green), 350 μm (orange), and 500 μm (red) in the GOODS north field. Dashed lines show the cumulative flux density directly from the observed GOODS-Herschel sources and the solid lines are the same but corrected by completeness from the simulations in this work. Resolved (Berta et al. 2010; Oliver et al. 2010; Berta et al. 2011; Magnelli et al. 2013), stacked (Berta et al. 2010; Béthermin et al. 2012) and P(D) results (Berta et al. 2011) at different adopted Slim are also shown for comparison, as well as IGL predictions for Herschel based on a model of multi-wavelength galaxy counts (Le Borgne et al. 2009). Horizontal dashed bands show the total extrapolated CIRB in the SPIRE bands adopted from Béthermin et al. (2012) using the same colour coding than for the curves and their widths represent the limits of the errors. In the case of PACS total values, vertical thick bars mark the error in the extrapolations of the CIRB calculated by Berta et al. (2011).
Current usage metrics show cumulative count of Article Views (full-text article views including HTML views, PDF and ePub downloads, according to the available data) and Abstracts Views on Vision4Press platform.
Data correspond to usage on the plateform after 2015. The current usage metrics is available 48-96 hours after online publication and is updated daily on week days.
Initial download of the metrics may take a while.