Fig. 14
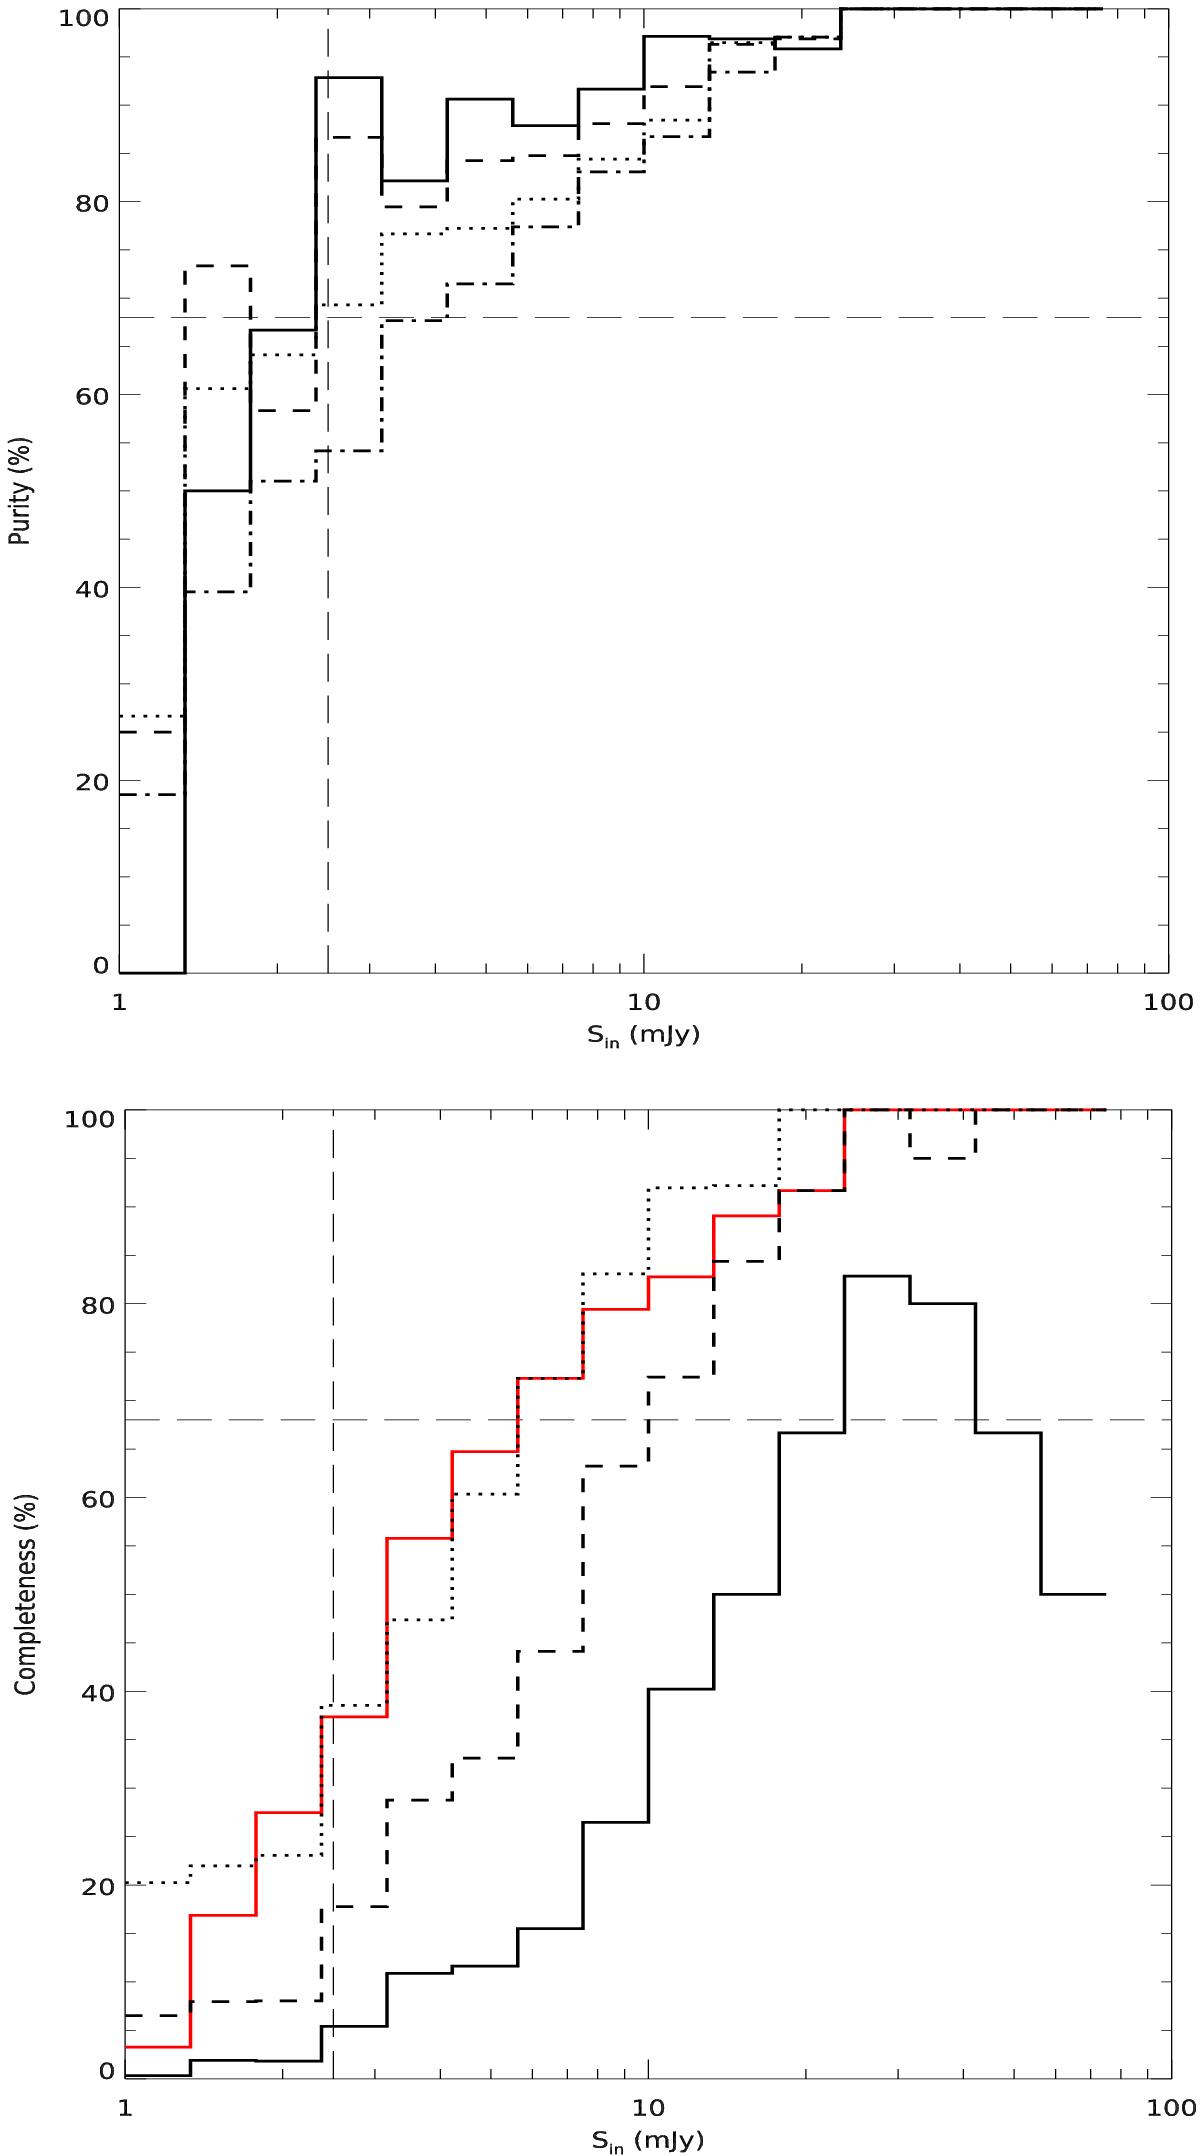
Quality of the source extraction on the mock Herschel images from a “purity” (top) and “completeness” (bottom) criterion. We present here the example of the 250 μm band. Top: purity of the sources extracted in the mock images defined as the fraction of sources with accurate photometry, i.e. | ΔS | /Sout≤ 0.32, among the sources selected using the clean index, CI. The different lines present the sources with no bright 24 μm neighbour, CI = 0 (solid line), at most one 24 μm neighbour, CI = 1 (dashed line), at most 2 neighbours, CI = 2 (dotted line), and the full sample of sources without any filtering (dash-dotted line). Bottom: completeness of the samples selected using the CI (same definition of the lines), defined as the ratio in percentage of the number of sources filtered by the CI over the total number of sources in each flux density bin (differential completeness). The red solid line shows the completeness of the sources with PAI = | ΔS | /Sout≤ 0.32, which are by definition associated with a 100% purity.
Current usage metrics show cumulative count of Article Views (full-text article views including HTML views, PDF and ePub downloads, according to the available data) and Abstracts Views on Vision4Press platform.
Data correspond to usage on the plateform after 2015. The current usage metrics is available 48-96 hours after online publication and is updated daily on week days.
Initial download of the metrics may take a while.