Fig. 12
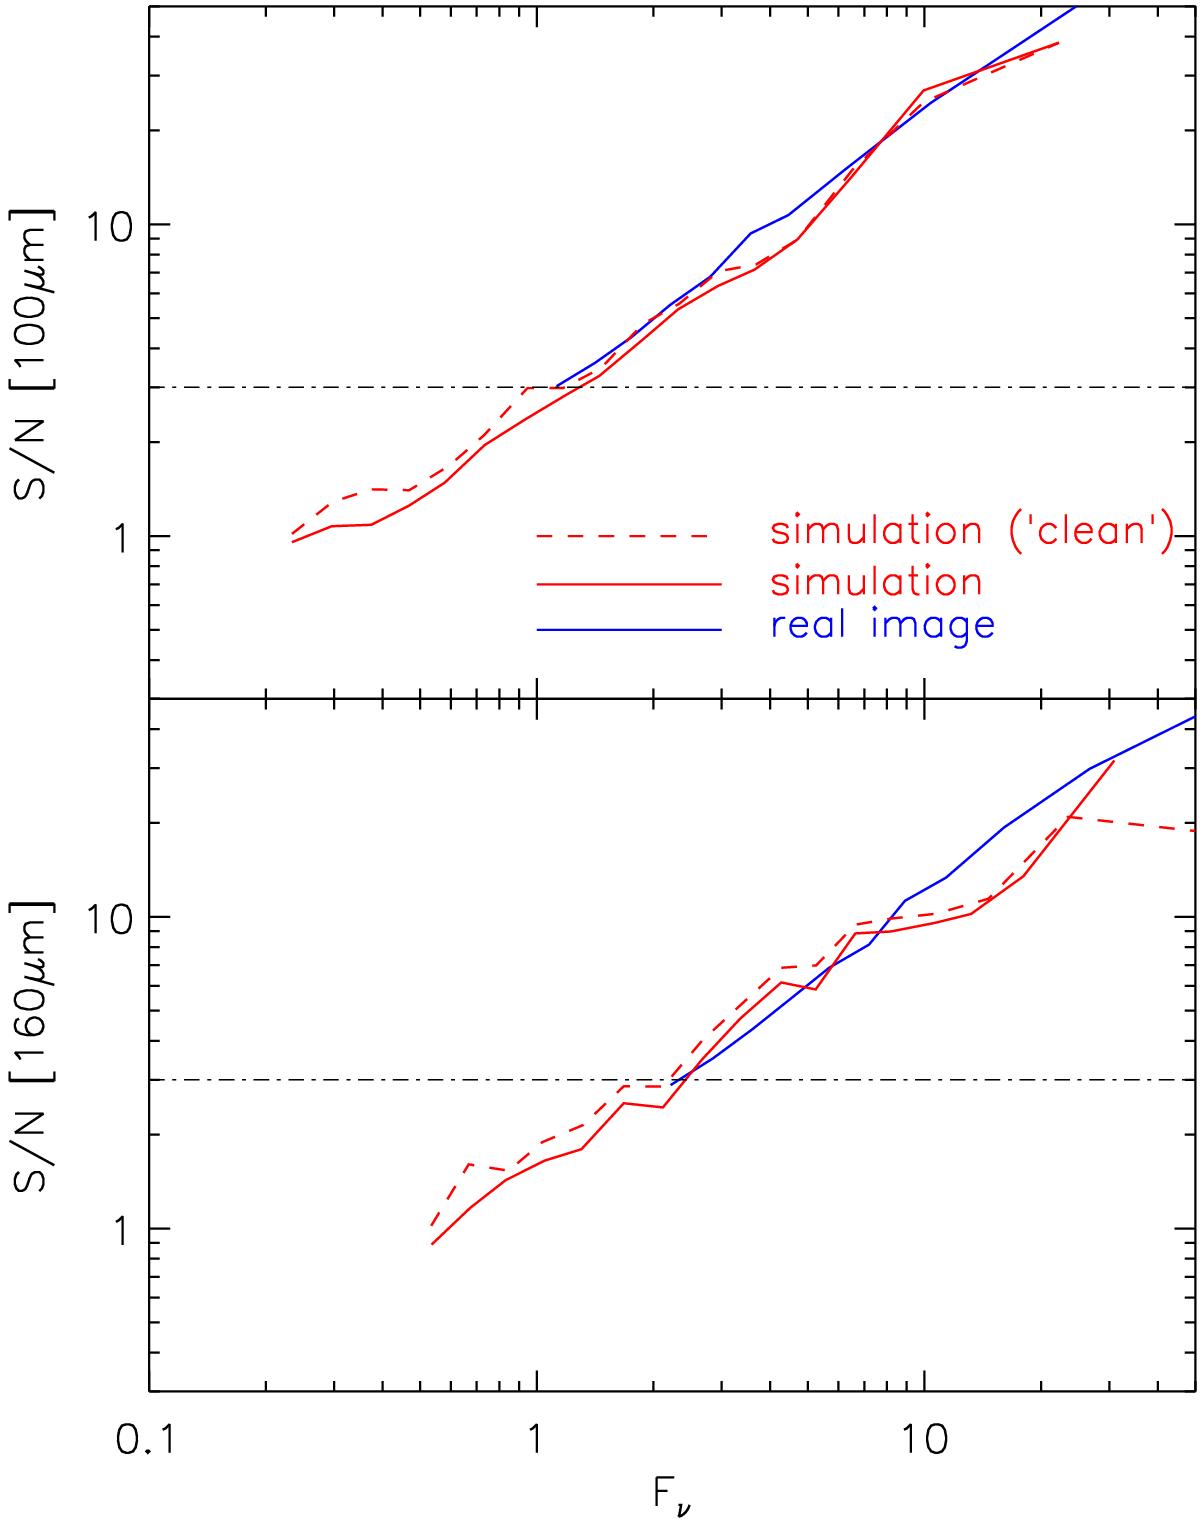
Signal-to-noise ratio as a function of flux for extracted sources in the Herschel/PACS maps (blue), the simulated images (solid red) and for the subset of clean sources in the simulation (dashed red line). The horizontal lines marks the 3σ level. The similarity in the trends demonstrates that the simulations reproduce well the sources of noise in the real image, i.e. the faint population of 24 μm prior sources, as well as the instrumental noise. Flux limits can also be defined for the Herschel data by the 3σ limits reached by clean sources (intersection between the dashed red line and the horizontal line).
Current usage metrics show cumulative count of Article Views (full-text article views including HTML views, PDF and ePub downloads, according to the available data) and Abstracts Views on Vision4Press platform.
Data correspond to usage on the plateform after 2015. The current usage metrics is available 48-96 hours after online publication and is updated daily on week days.
Initial download of the metrics may take a while.