Fig. 11
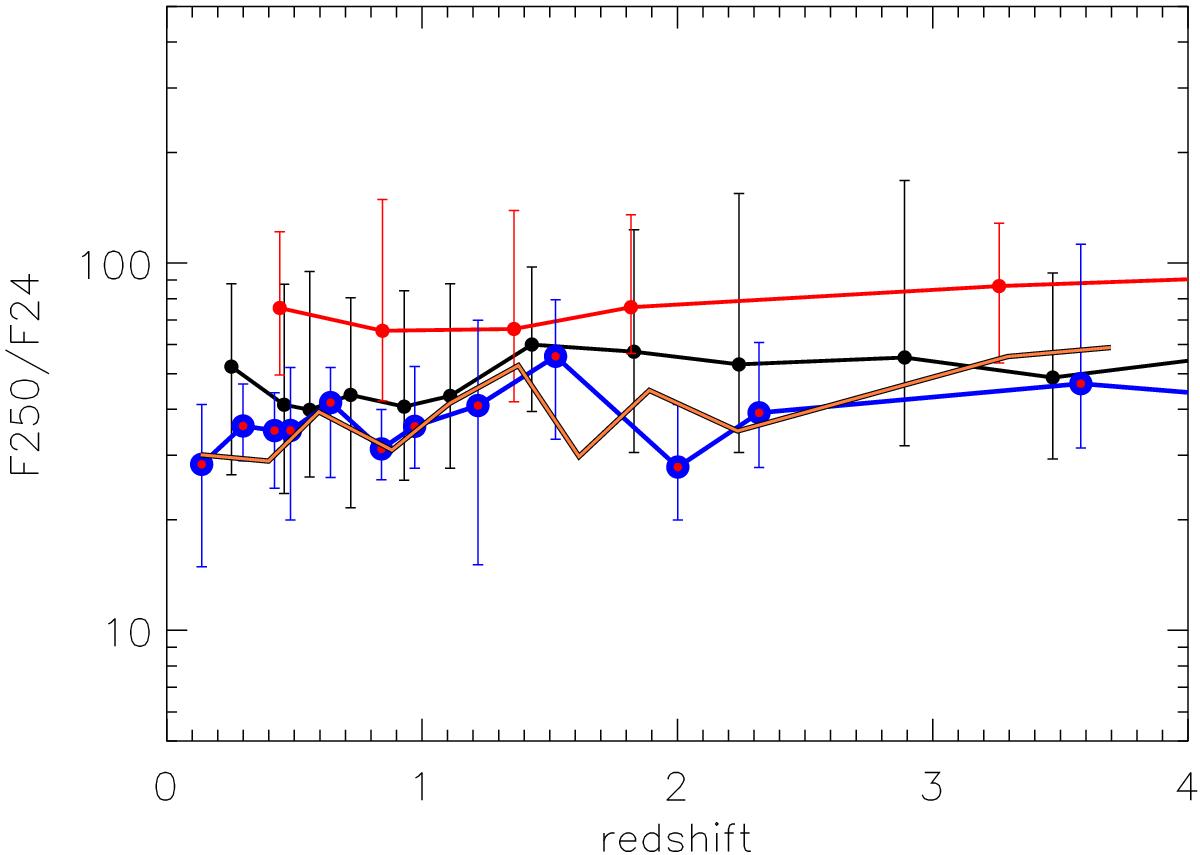
Comparison of observed S250/S24 colours for sources with flux densities between 3 <S250< 5.7 mJy selected by their associated photometry accuracy from the simulations. The median colours of sources with a good photometric accuracy | ΔS | /Sout≤ 0.32 (black line) follow the colour trend, of clean-selected sources CI ≤ 1 (blue line) and the stacked sources (orange line) while the median colours of sources having poor photometric accuracy | ΔS | /Sout> 0.32 (red line) are systematically displaced to brighter 250 μm fluxes, an indication of blending.
Current usage metrics show cumulative count of Article Views (full-text article views including HTML views, PDF and ePub downloads, according to the available data) and Abstracts Views on Vision4Press platform.
Data correspond to usage on the plateform after 2015. The current usage metrics is available 48-96 hours after online publication and is updated daily on week days.
Initial download of the metrics may take a while.