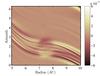
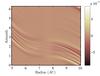
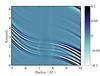
Fig. 4
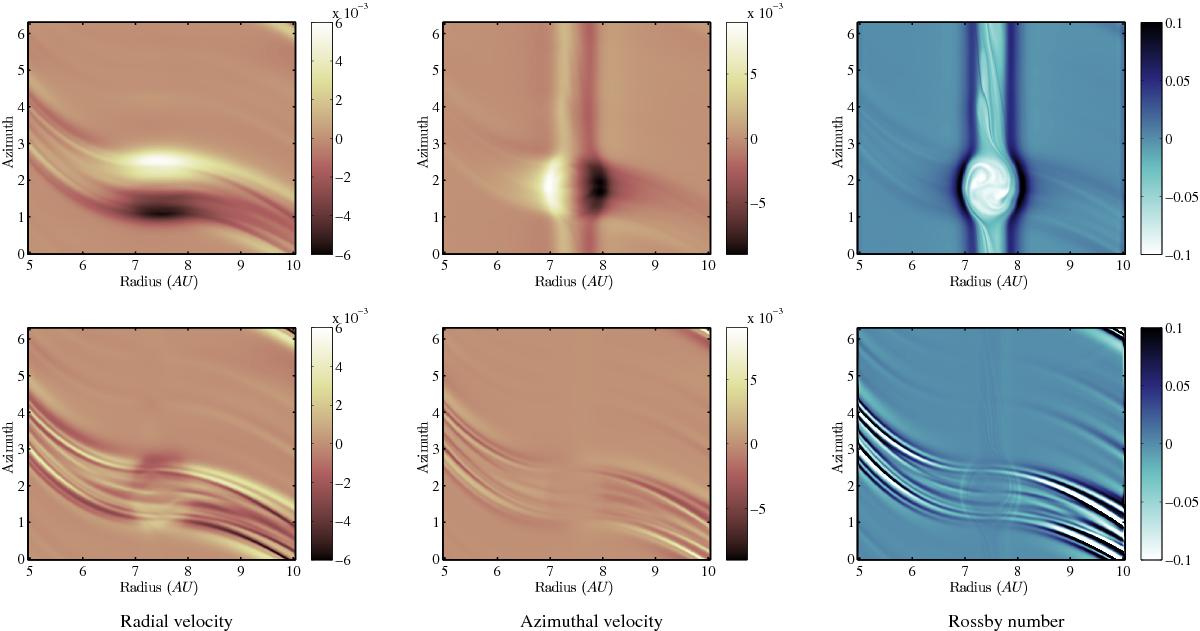
Velocity field of a Rossby vortex: comparison of the numerical solution with the Gaussian model. Top row: values issued from the simulation of the radial velocity, the azimuthal velocity V−V0(r), and the Rossby number, from left to right, respectively. Bottom row: residual difference between the numerical data and the values issued from the model for the radial and azimuthal velocities and for the Rossby number, from left to right, respectively (see text for details).
Current usage metrics show cumulative count of Article Views (full-text article views including HTML views, PDF and ePub downloads, according to the available data) and Abstracts Views on Vision4Press platform.
Data correspond to usage on the plateform after 2015. The current usage metrics is available 48-96 hours after online publication and is updated daily on week days.
Initial download of the metrics may take a while.