Fig. 10
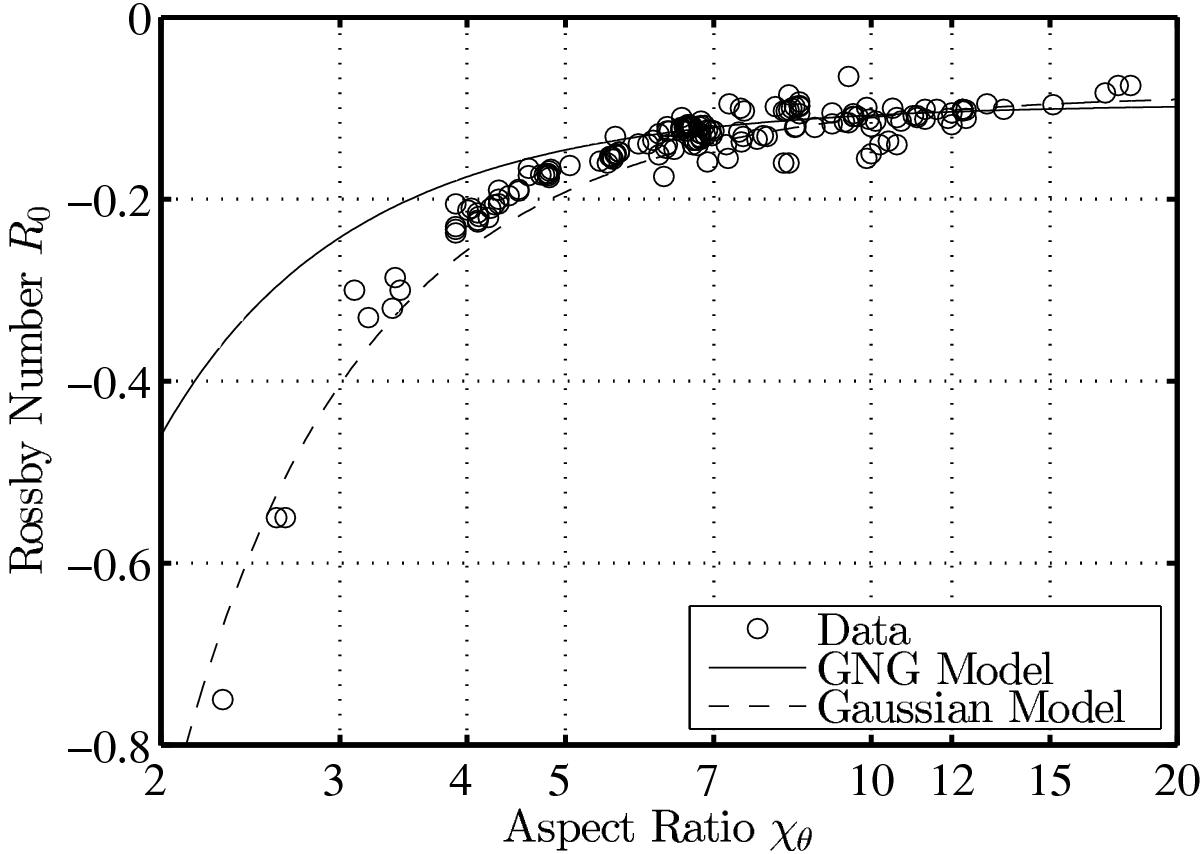
Rossby number at the vortex centre, as a function of the aspect ratio χθ for the vortices used in our sample (black circles). Different expressions relating these two quantities are shown: the GNG model (solid line) which underestimates Ro as soon as χθ< 7, and the Gaussian model (dashed line) which better fits the data for 2 <χθ< 20. We note the logarithmic scale for χθ.
Current usage metrics show cumulative count of Article Views (full-text article views including HTML views, PDF and ePub downloads, according to the available data) and Abstracts Views on Vision4Press platform.
Data correspond to usage on the plateform after 2015. The current usage metrics is available 48-96 hours after online publication and is updated daily on week days.
Initial download of the metrics may take a while.