Free Access
Fig. 9
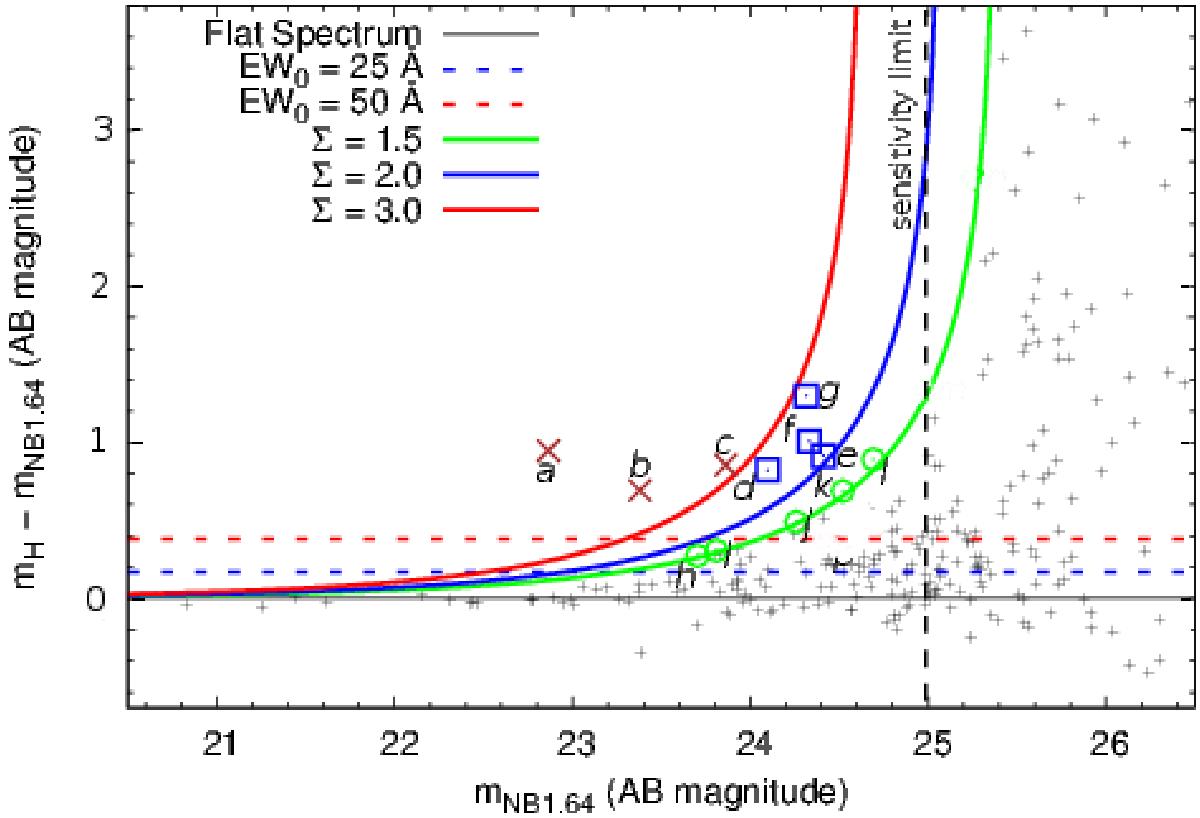
Broad- to narrowband color−magnitude diagram of our candidate Hα emitters. Hα candidates are labeled with colored symbols, depending on the significance of their detection. Letters refer to the sources shown in Fig. A.1. Source “a” is the HzRG.
Current usage metrics show cumulative count of Article Views (full-text article views including HTML views, PDF and ePub downloads, according to the available data) and Abstracts Views on Vision4Press platform.
Data correspond to usage on the plateform after 2015. The current usage metrics is available 48-96 hours after online publication and is updated daily on week days.
Initial download of the metrics may take a while.