Fig. 8
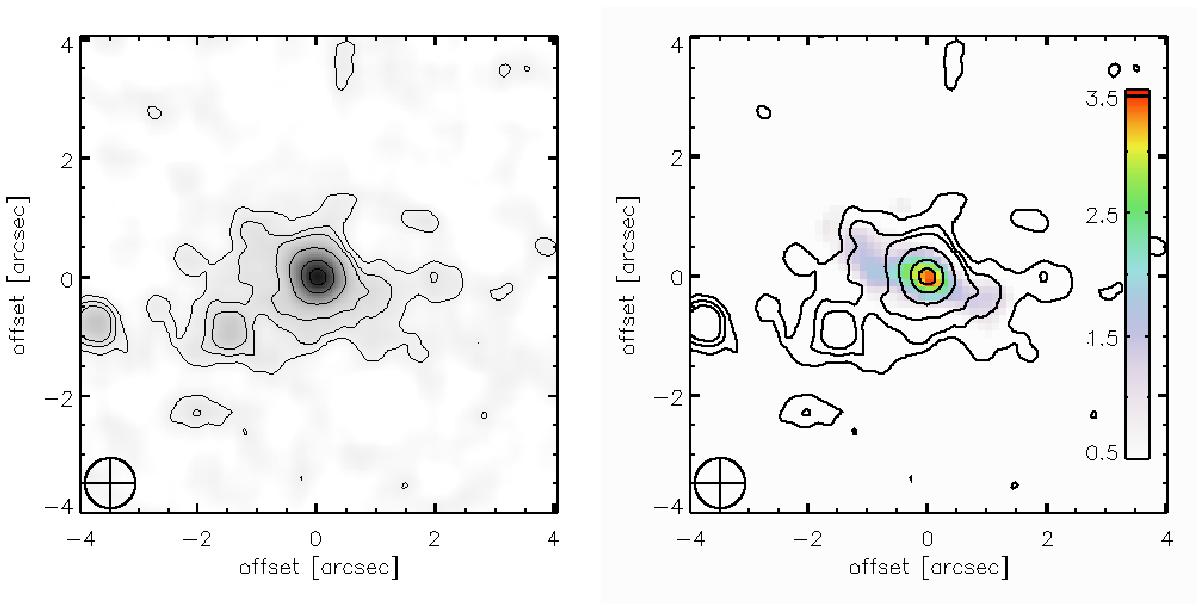
Left: ISAAC K-band broadband image of NVSS J210626-314003 smoothed to the same spatial resolution as the SINFONI imaging spectroscopy, 1′′. Right: Hα morphology of NVSS J210626-314003. The color bar shows the contamination to the flux density measured in the broadband filter from Hα line emission in units of 10-19 erg s-1 cm-2 Å-1 arcsec-1. Contours show the broadband K-band morphology and are the same as in the left panel. The contour levels correspond to 3, 5, 7, 15, and 30× the root-mean square of the broadband image smoothed to the SINFONI resolution of 1′′, which has rms = 3 × 10-20 erg s-1 cm-2 Å-1 arcsec-1. The circles in the lower left of each panel show the size of the seeing disk.
Current usage metrics show cumulative count of Article Views (full-text article views including HTML views, PDF and ePub downloads, according to the available data) and Abstracts Views on Vision4Press platform.
Data correspond to usage on the plateform after 2015. The current usage metrics is available 48-96 hours after online publication and is updated daily on week days.
Initial download of the metrics may take a while.