Fig. 7
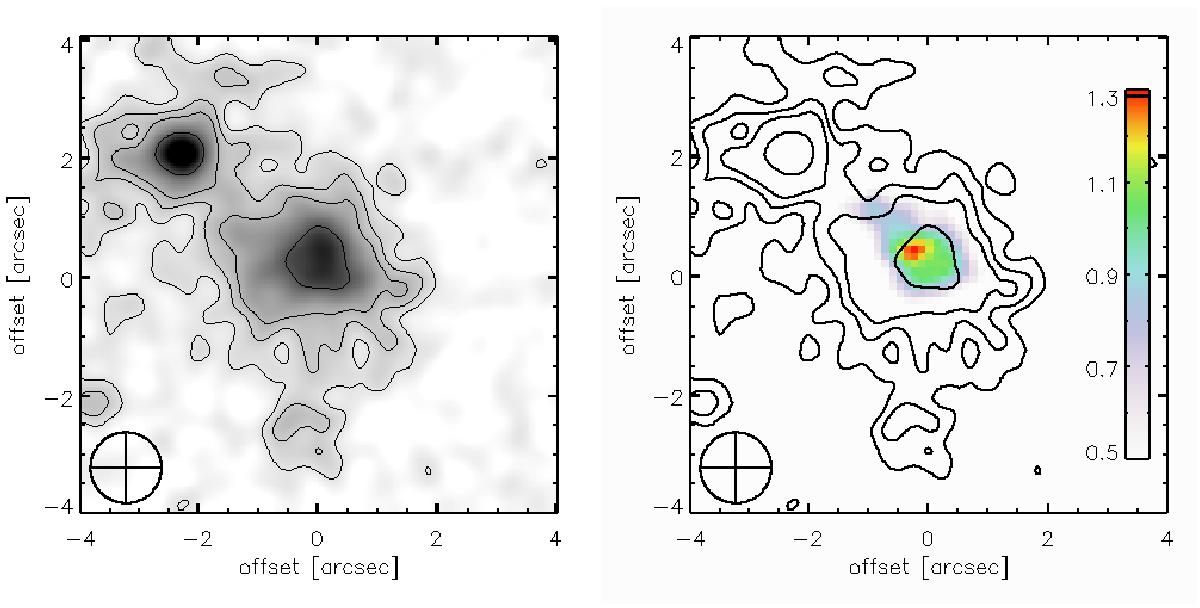
Left: ISAAC H-band broadband image of TXS 2353−003 convolved with a two-dimensional Gaussian to match the spatial resolution of the Hα + [ NII ] map shown in the right panel. Right: Hα morphology of TXS 2353−003, convolved with a two-dimensional Gaussian to emphasize the morphology of the faint northeastern extension at a spatial resolution of 1.2′′. The color bar shows the contamination to the flux density measured in the broadband filter from Hα line emission in units of 10-19 erg s-1 cm-2 Å-1 arcsec-1. Contours show the broadband K-band morphology and are identical to those shown in the left panel. Starting from the outermost contour, the broadband fluxes represented by each contour are 1.1, 1.8, 2.5, and 5.4 × 10⁻¹⁹ erg s-1 cm-2 Å-1 arcsec-1 (3, 5, 7, and 15σ in the convolved image, where σ = 3.9 × 10⁻²⁰ erg s-1 cm-2 Å-1 arcsec-1). The circles in the lower left of each panel show the size of the convolved PSF.
Current usage metrics show cumulative count of Article Views (full-text article views including HTML views, PDF and ePub downloads, according to the available data) and Abstracts Views on Vision4Press platform.
Data correspond to usage on the plateform after 2015. The current usage metrics is available 48-96 hours after online publication and is updated daily on week days.
Initial download of the metrics may take a while.