Fig. 6
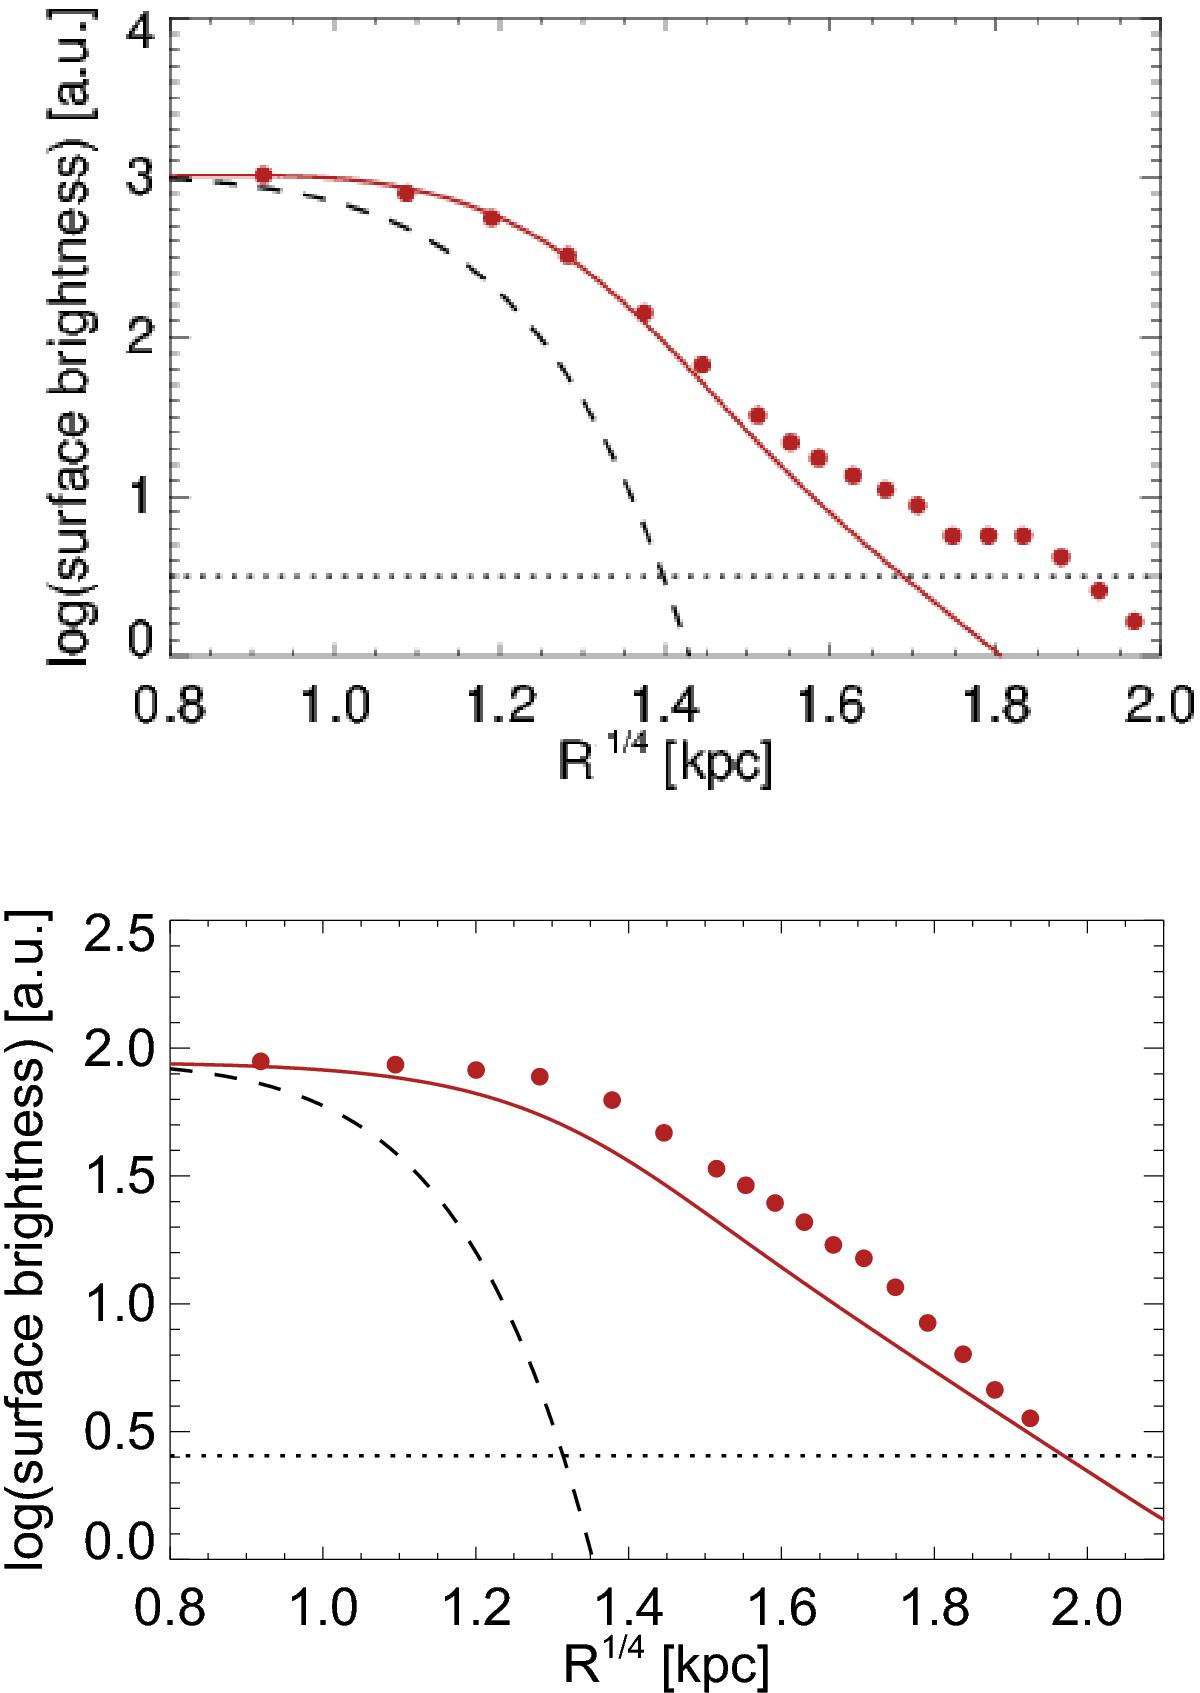
Surface-brightness profiles of NVSS J210626-314003 (top) and TXS 2353−003 (bottom) extracted from ISAAC H-band and Ks-band images, respectively. Red dots show the measured azimuthally averaged surface brightnesses as a function of R1 / 4. Red lines show a Sérsic fit with n = 4, corresponding to the de Vaucouleurs law for classical elliptical galaxies, and convolved with the point spread function in each image. The dashed black lines show the size of the seeing disk. Dotted horizonal lines show the 3σ limiting surface brightness of our images. Excess flux at large radii compared to the R1 / 4 law is characteristic for brightest cluster galaxies in evolved galaxy clusters (e.g., Schombert 1987).
Current usage metrics show cumulative count of Article Views (full-text article views including HTML views, PDF and ePub downloads, according to the available data) and Abstracts Views on Vision4Press platform.
Data correspond to usage on the plateform after 2015. The current usage metrics is available 48-96 hours after online publication and is updated daily on week days.
Initial download of the metrics may take a while.