Fig. 5
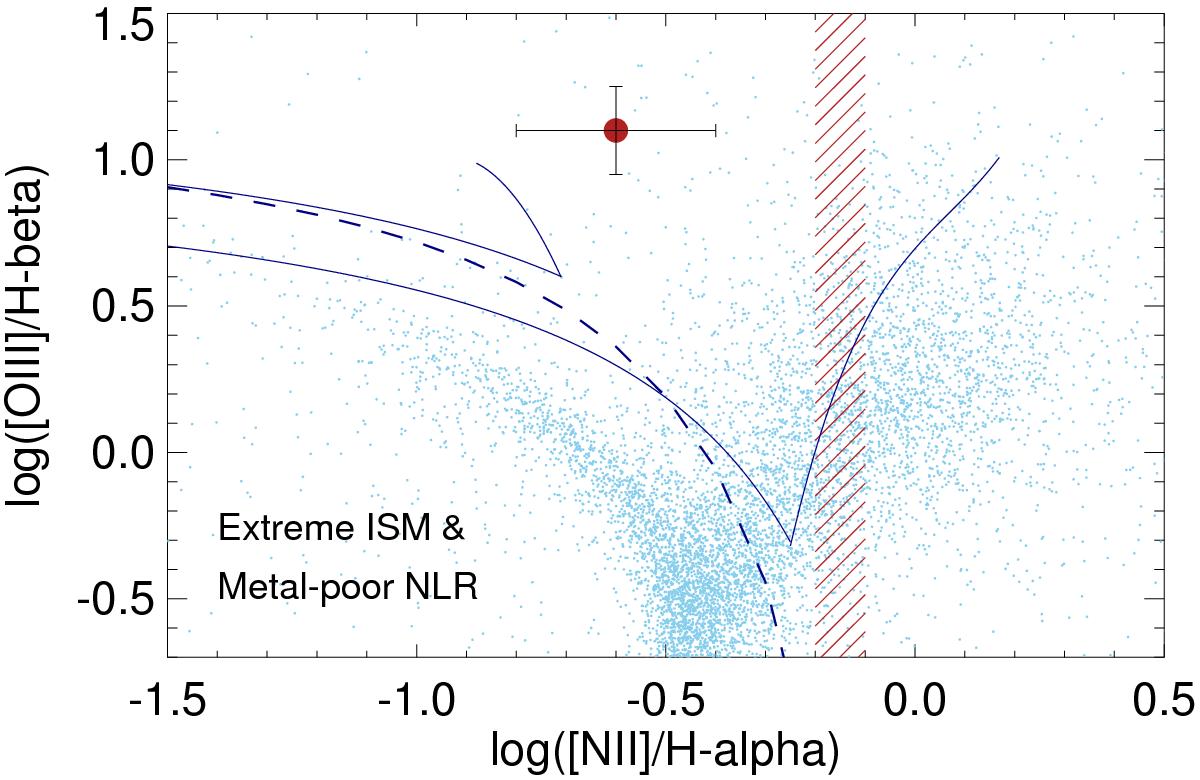
Diagnostic diagram showing the ratio of [OIII]/Hβ as a function of [NII]/Hα line ratio (Baldwin et al. 1981; Veilleux & Osterbrock 1987). The red dot shows the position of NVSS J210626-314003. The red hatched area shows the region spanned by the [NII]/Hα ratio in the off-nucleus gas in TXS 2353-003. Light blue dots indicate the distribution of line ratios for galaxies in the local Universe (from SDSS; see Kauffmann et al. 2003), and the dashed blue line shows the diagnostic of Kewley et al. (2006) to separate HII regions and star-forming galaxies (below) from AGN (above). The solid blue lines indicate how the distribution of line ratios for both SF galaxies and AGN are expected to evolve out to high redshift (Kewley et al. 2013, their model 4 with metal-poor narrow-line regions): the two HzRGs are clearly consistent with the predictions for high redshift AGN.
Current usage metrics show cumulative count of Article Views (full-text article views including HTML views, PDF and ePub downloads, according to the available data) and Abstracts Views on Vision4Press platform.
Data correspond to usage on the plateform after 2015. The current usage metrics is available 48-96 hours after online publication and is updated daily on week days.
Initial download of the metrics may take a while.