Fig. 4
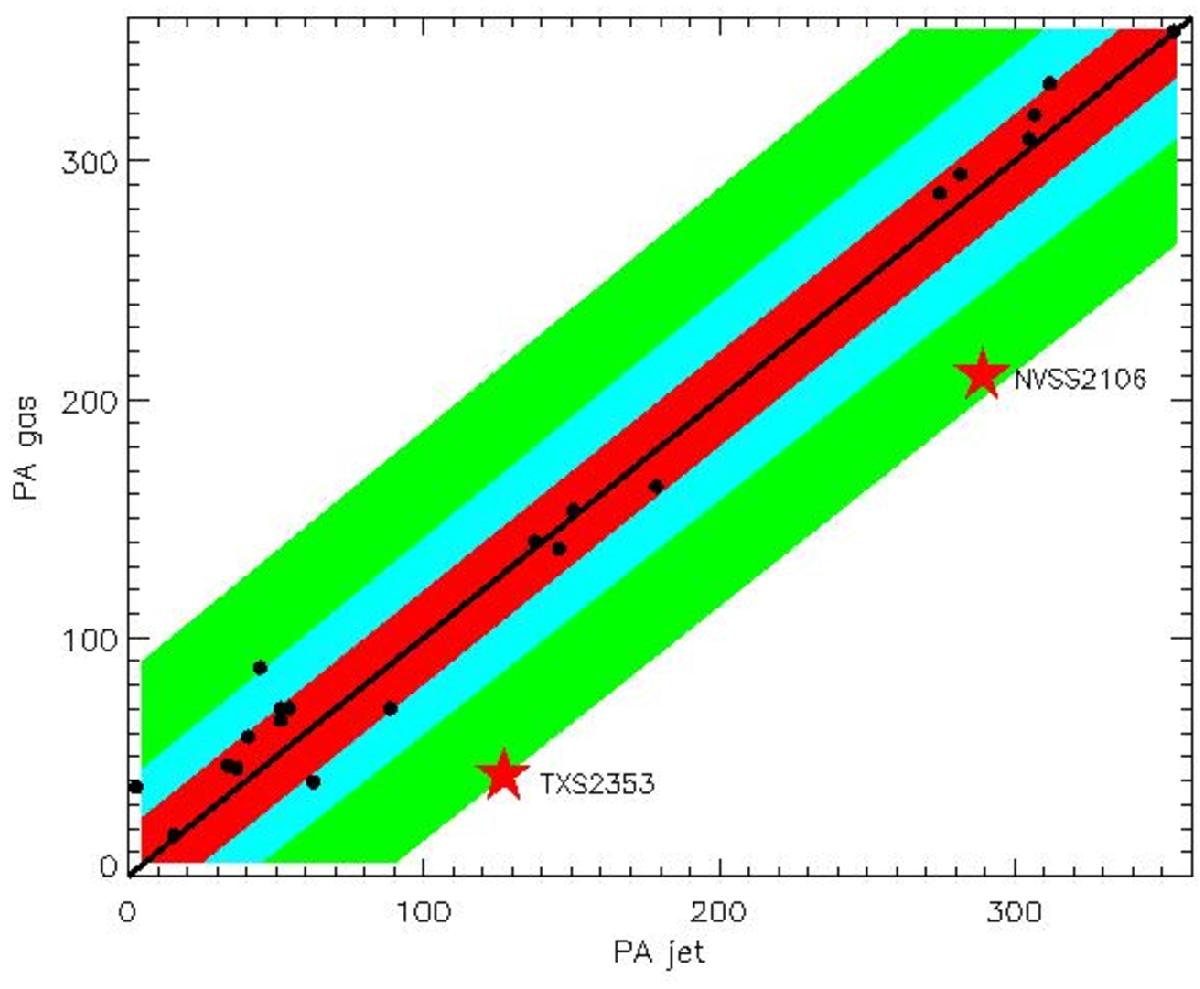
Position angle (north through east) of the gas (ordinate) as a function of the position angle of the radio jet for our two sources. The outer boundaries of the red, blue, and green stripes indicate offsets of 20°, 45°, and 90°, respectively. Red stars indicate our two sources discussed here, small black dots show the remaining HzRGs with SINFONI data and well-determined position angles (Nesvadba et al., in prep.).
Current usage metrics show cumulative count of Article Views (full-text article views including HTML views, PDF and ePub downloads, according to the available data) and Abstracts Views on Vision4Press platform.
Data correspond to usage on the plateform after 2015. The current usage metrics is available 48-96 hours after online publication and is updated daily on week days.
Initial download of the metrics may take a while.