Free Access
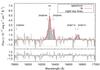
Fig. 3
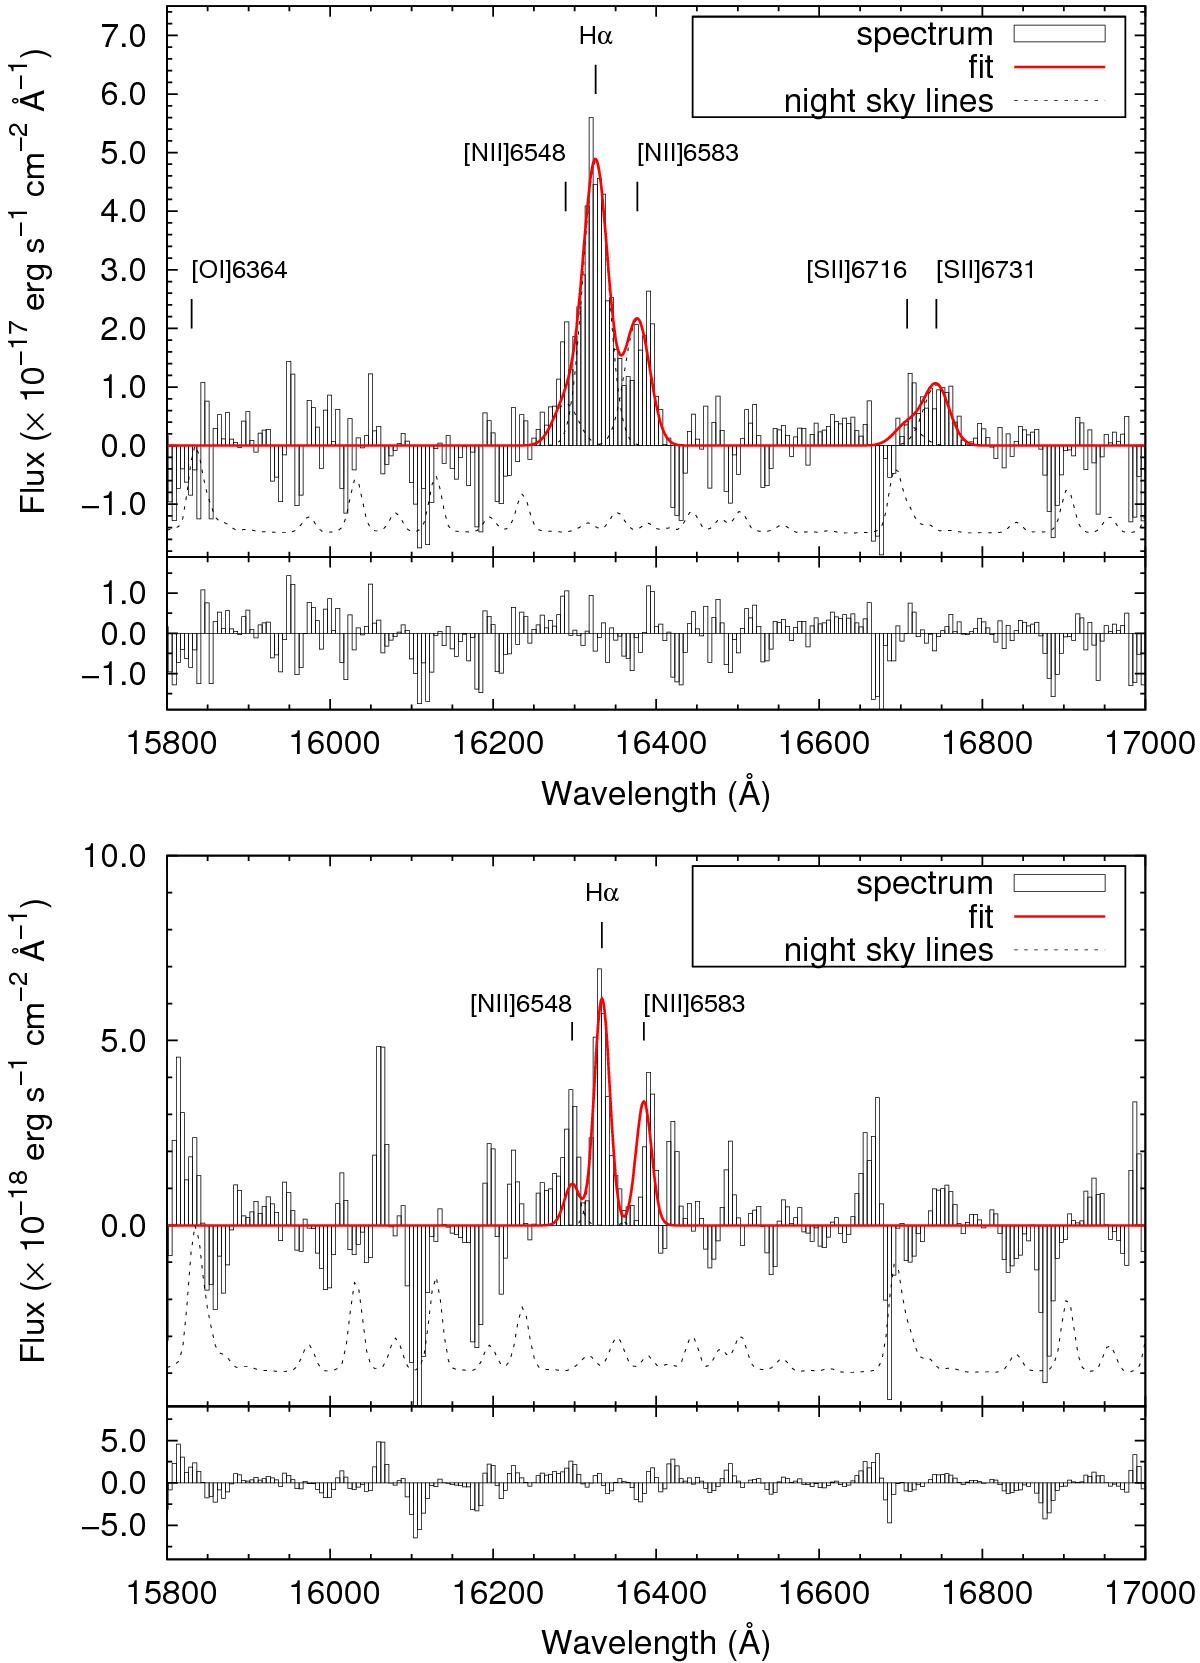
Top: spectrum of TXS 2353−003, integrated over all spatial pixels where the Hα emission from the galaxy is detected at ≥3σ, and corrected for velocity shifts. Bottom: integrated spectrum of the northeastern part of the emission-line region of TXS 2353−003, defined by the dotted square in Fig. 1.
This figure is made of several images, please see below:
Current usage metrics show cumulative count of Article Views (full-text article views including HTML views, PDF and ePub downloads, according to the available data) and Abstracts Views on Vision4Press platform.
Data correspond to usage on the plateform after 2015. The current usage metrics is available 48-96 hours after online publication and is updated daily on week days.
Initial download of the metrics may take a while.