Fig. 2
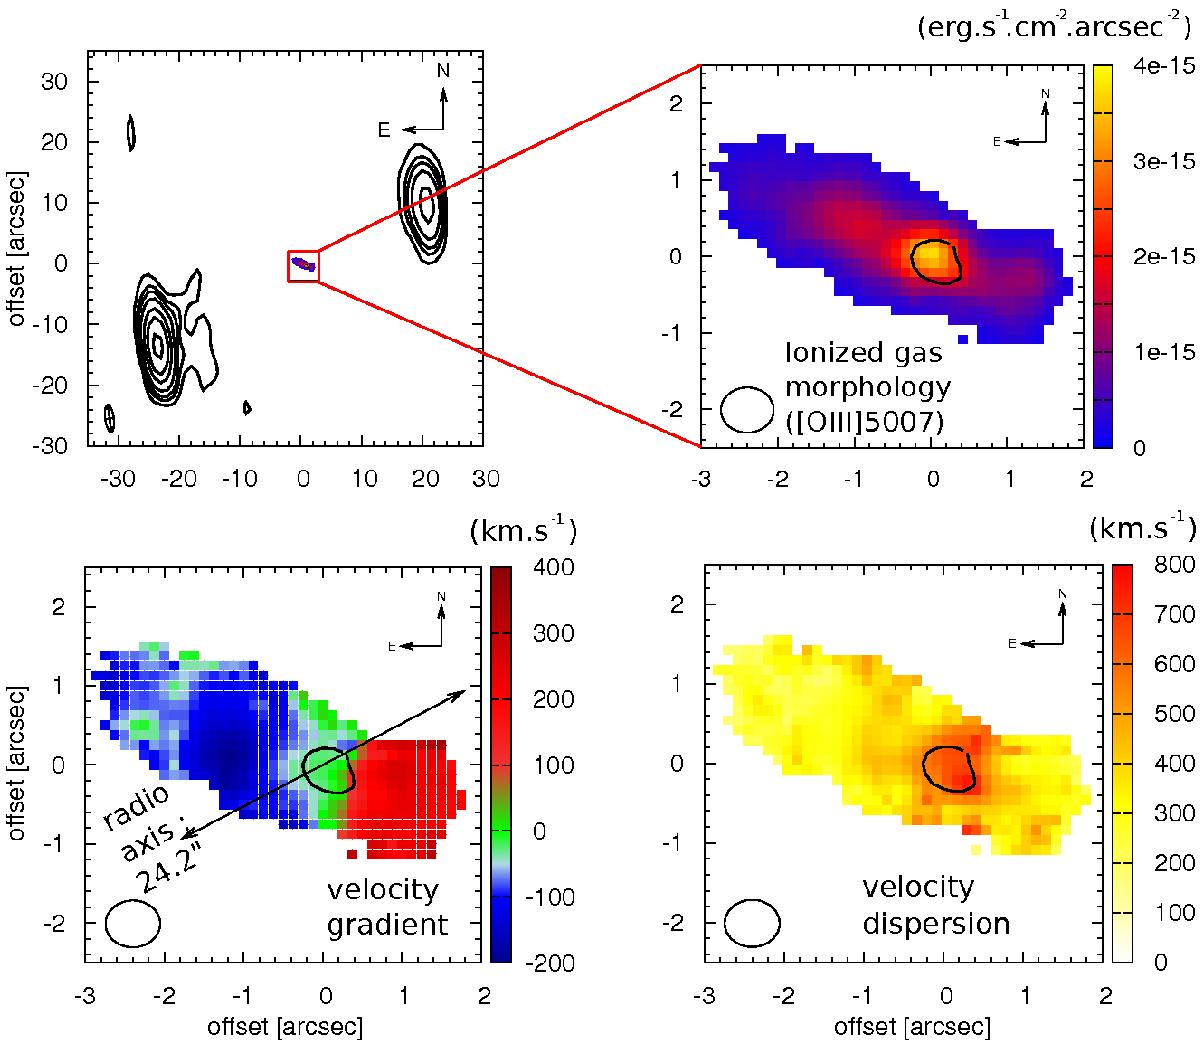
Results of our observations of NVSS J210626−314003. Top left: 5.5 GHz contours from ATCA. Clockwise from top right to bottom left: SINFONI maps of [OIII]λ5007 surface brightness, FWHM line widths, and relative velocities. The square in the top left shows the size of the SINFONI maps compared to radio size. The black contour marks the continuum position in our SINFONI cube. Ellipses in the lower left corner of each panel show the FWHM size of the point spread function.
Current usage metrics show cumulative count of Article Views (full-text article views including HTML views, PDF and ePub downloads, according to the available data) and Abstracts Views on Vision4Press platform.
Data correspond to usage on the plateform after 2015. The current usage metrics is available 48-96 hours after online publication and is updated daily on week days.
Initial download of the metrics may take a while.