Fig. A.1
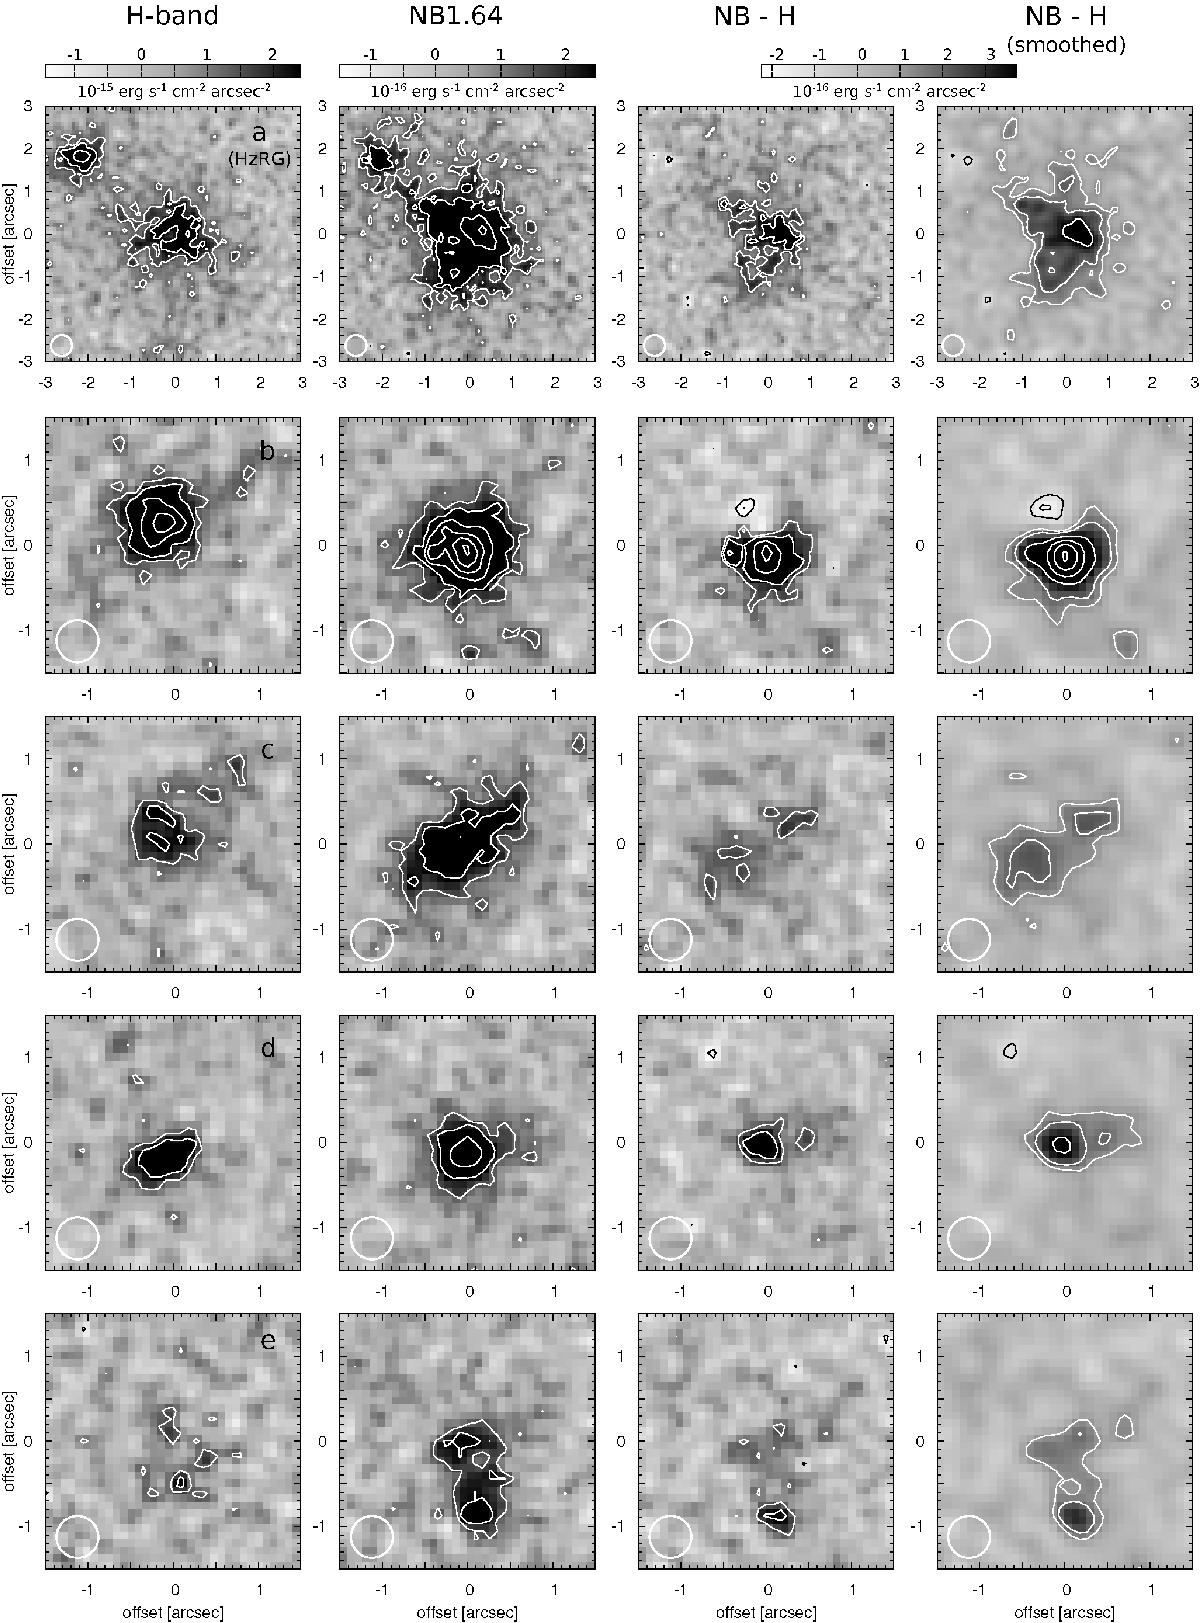
Hα emitters around TXS 2353-003 selected by the Bunker plot and confirmed when subtracting the continuum from the NB image. Left column: H-band images of the candidates. Middle column: NB1.64 images of the candidates. Right columns: continuum-subtracted NB images of the candidates, the last column showing them smoothed with a Gaussian kernel of σ = 1 pixel. The color palette spans − 3σ to + 5σ in each case in order to highlight the faint features of these HAE candidates. The contours give the morphology of the sources at larger surface brightnesses: white contours are at levels 3; 5; 10; 15; 20 σ and the black contours are at levels − 10; − 5; − 3σ. The HzRG is labeled “a”.
Current usage metrics show cumulative count of Article Views (full-text article views including HTML views, PDF and ePub downloads, according to the available data) and Abstracts Views on Vision4Press platform.
Data correspond to usage on the plateform after 2015. The current usage metrics is available 48-96 hours after online publication and is updated daily on week days.
Initial download of the metrics may take a while.