Fig. 11
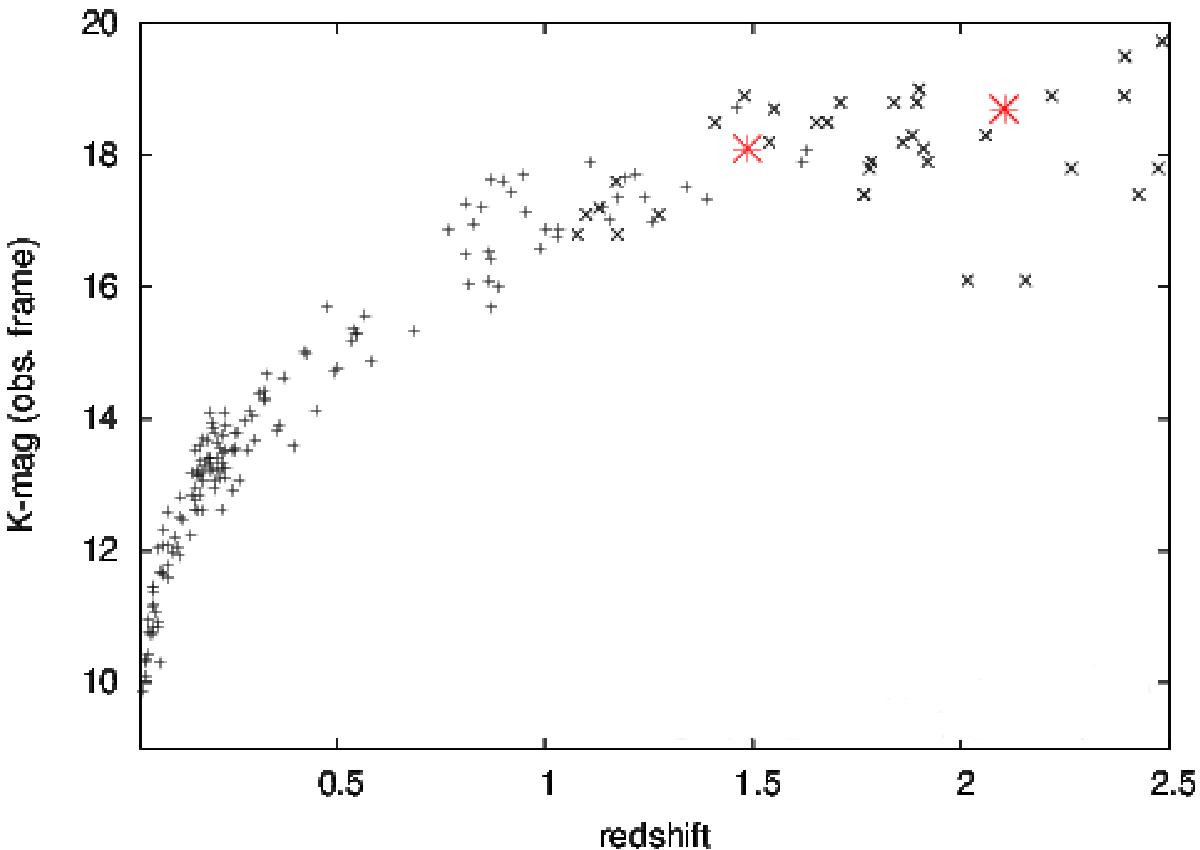
Observed K-band magnitude of brightest-cluster galaxies (shown as “+”) and radio galaxies (shown as “x”) as a function of redshift (plot reproduced from Lidman et al. 2012). Some of the data points were taken from Stott et al. (2008, 2010). The large red stars illustrate that TXS 2353−003 and NVSS J210626−314003 fall well within the expected range of K-band magnitude, and also have typical K-band magnitudes for HzRGs at their redshifts (black crosses; Seymour et al. 2007; see also De Breuck et al. 2002; Willott et al. 2003; Bryant et al. 2009). At z ≥ 2, Hα and [NII]λλ6548,6583 fall into the K-band filter and can affect the continuum magnitudes by up to about 0.3 dex in extreme cases (Nesvadba et al. 2006).
Current usage metrics show cumulative count of Article Views (full-text article views including HTML views, PDF and ePub downloads, according to the available data) and Abstracts Views on Vision4Press platform.
Data correspond to usage on the plateform after 2015. The current usage metrics is available 48-96 hours after online publication and is updated daily on week days.
Initial download of the metrics may take a while.