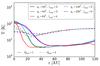
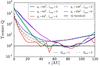
Fig. 8

Radial profiles of the temperature distribution and effective Toomre Q parameter for all simulations with Rdisk = 100 and t = 1.5 Tdisk. As the density distribution the temperature shows a spread-out for the inner and outer parts. This is much more pronounced for the simulations with Qinit = 1, whereas the runs with Qinit = 3 roughly follow the initial distribution. For Qinit = 3, the effective Q parameter stays well above the threshold for marginal stability. In comparison, the effective Q in the Qinit = 1 runs dips below the threshold at the positions with increased density (i.e., fragmenting regions, compare Fig. 7).
Current usage metrics show cumulative count of Article Views (full-text article views including HTML views, PDF and ePub downloads, according to the available data) and Abstracts Views on Vision4Press platform.
Data correspond to usage on the plateform after 2015. The current usage metrics is available 48-96 hours after online publication and is updated daily on week days.
Initial download of the metrics may take a while.