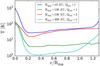
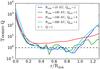
Fig. 11

Radial profiles at t = 1.5 Tdisk for temperature T and effective Toomre Q parameter for all simulations with the highest resolution on the finest grid, normalized in radial direction. The simulation with Qinit = 3 is added for comparison. Again, we see a different behavior of the simulation with Rdisk = 100 AU and Qinit = 1, displaying a smaller increase in temperature because of its smoother transition zone. The dips where the Q parameter goes below 1 are consistent with the density peaks in Figs. 10 and 12.
Current usage metrics show cumulative count of Article Views (full-text article views including HTML views, PDF and ePub downloads, according to the available data) and Abstracts Views on Vision4Press platform.
Data correspond to usage on the plateform after 2015. The current usage metrics is available 48-96 hours after online publication and is updated daily on week days.
Initial download of the metrics may take a while.