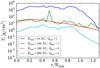
Fig. 10

Radial profiles at t = 1.5 Tdisk for column density Σ and rotational velocity vrot for all simulations with the highest resolution on the finest grid, normalized in radial direction. The simulation with Qinit = 3 is added for comparison. The density distributions for all radii show similarities. However, the simulation with r = 100 AU and Qinit = 1 shows its single peak at ~52 AU and the negative slope at the outer edge of the disk is much shallower than the slope of the other simulations with Qinit = 1. The velocity distributions for all radii show a similar trend. The simulation with r = 10 AU abruptly goes down in velocity. This behavior might be due to the very sharp transition from disk material (with approximately Keplerian velocity profile) to surrounding material (with approximately zero velocity).
Current usage metrics show cumulative count of Article Views (full-text article views including HTML views, PDF and ePub downloads, according to the available data) and Abstracts Views on Vision4Press platform.
Data correspond to usage on the plateform after 2015. The current usage metrics is available 48-96 hours after online publication and is updated daily on week days.
Initial download of the metrics may take a while.