Fig. 4
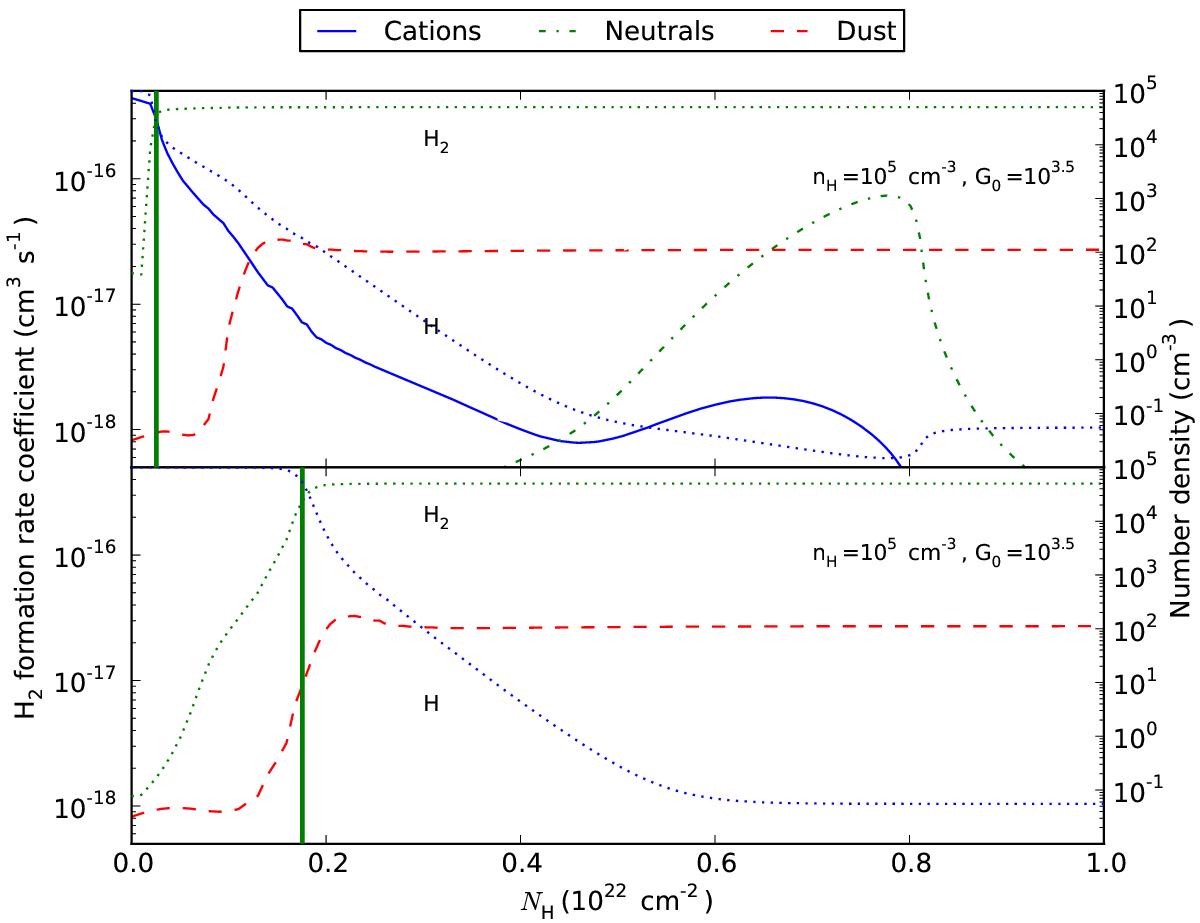
Comparison between two identical clouds, with (top panel) and without (bottom panel) H2 formation on coronene. H2 formation rate coefficients on ionized (solid) and neutral (dashed-dotted) coronene and dust grains (dashed lines) are represented on the left y-axis. Number densities of H and H2 (dotted lines) are represented on the right y-axis. The thick vertical green line indicates the location where n(H) = 2·n(H2). G0 = 103.5 and nH = 105 cm-3.
Current usage metrics show cumulative count of Article Views (full-text article views including HTML views, PDF and ePub downloads, according to the available data) and Abstracts Views on Vision4Press platform.
Data correspond to usage on the plateform after 2015. The current usage metrics is available 48-96 hours after online publication and is updated daily on week days.
Initial download of the metrics may take a while.