Fig. 3
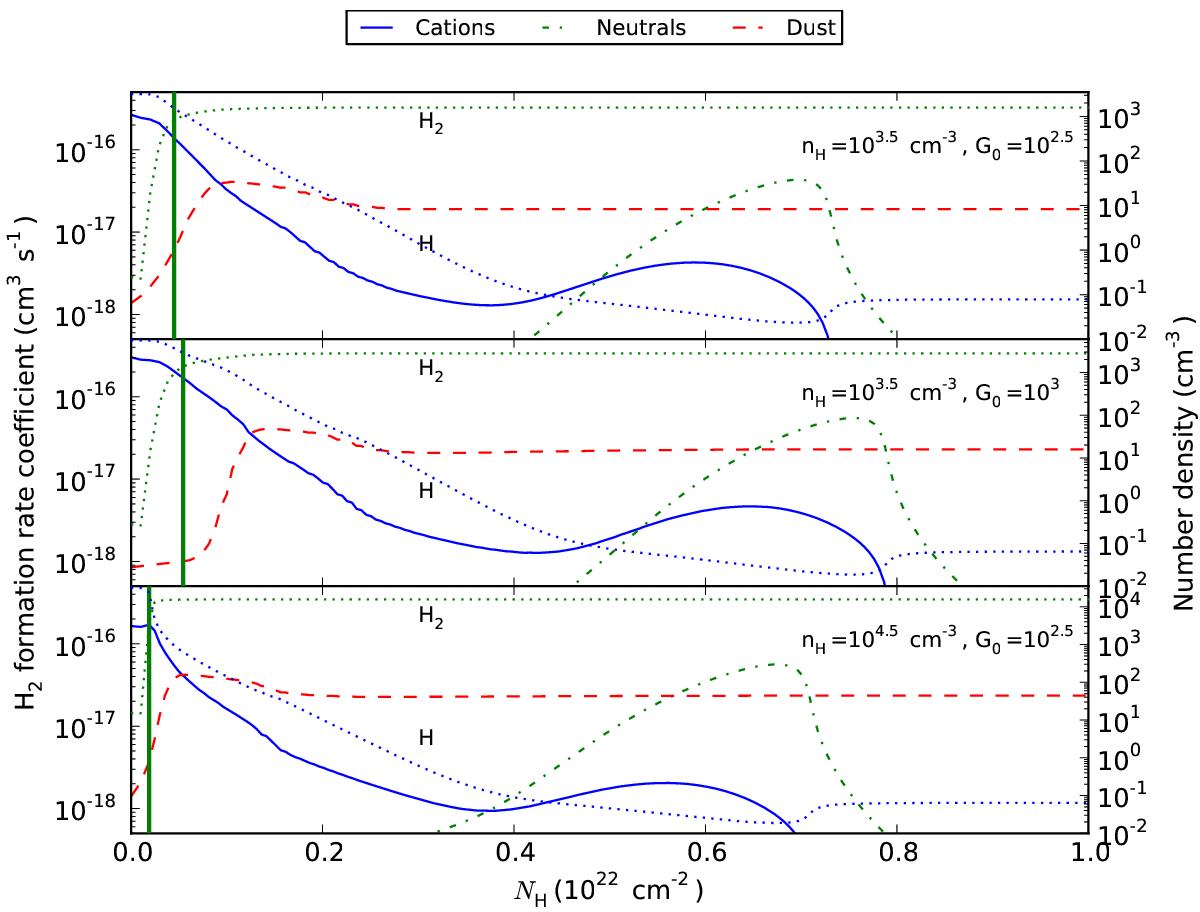
H2 formation rate coefficients on cationic and neutral coronene and dust (solid, dashed-dotted, and dashed lines, left y-axis) and distributions of H and H2 (dotted lines, right y-axis). The top graph has G0 = 102.5 and nH = 103.5 cm-3, the middle graph G0 = 103.0 and nH = 103.5 cm-3, and the bottom graph corresponds to G0 = 102.5 and nH = 104.5 cm-3. The vertical line marks the location of the H/H2 transition, where n(H) = 2·n(H2).
Current usage metrics show cumulative count of Article Views (full-text article views including HTML views, PDF and ePub downloads, according to the available data) and Abstracts Views on Vision4Press platform.
Data correspond to usage on the plateform after 2015. The current usage metrics is available 48-96 hours after online publication and is updated daily on week days.
Initial download of the metrics may take a while.