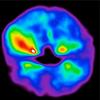
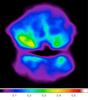
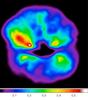
Fig. 4
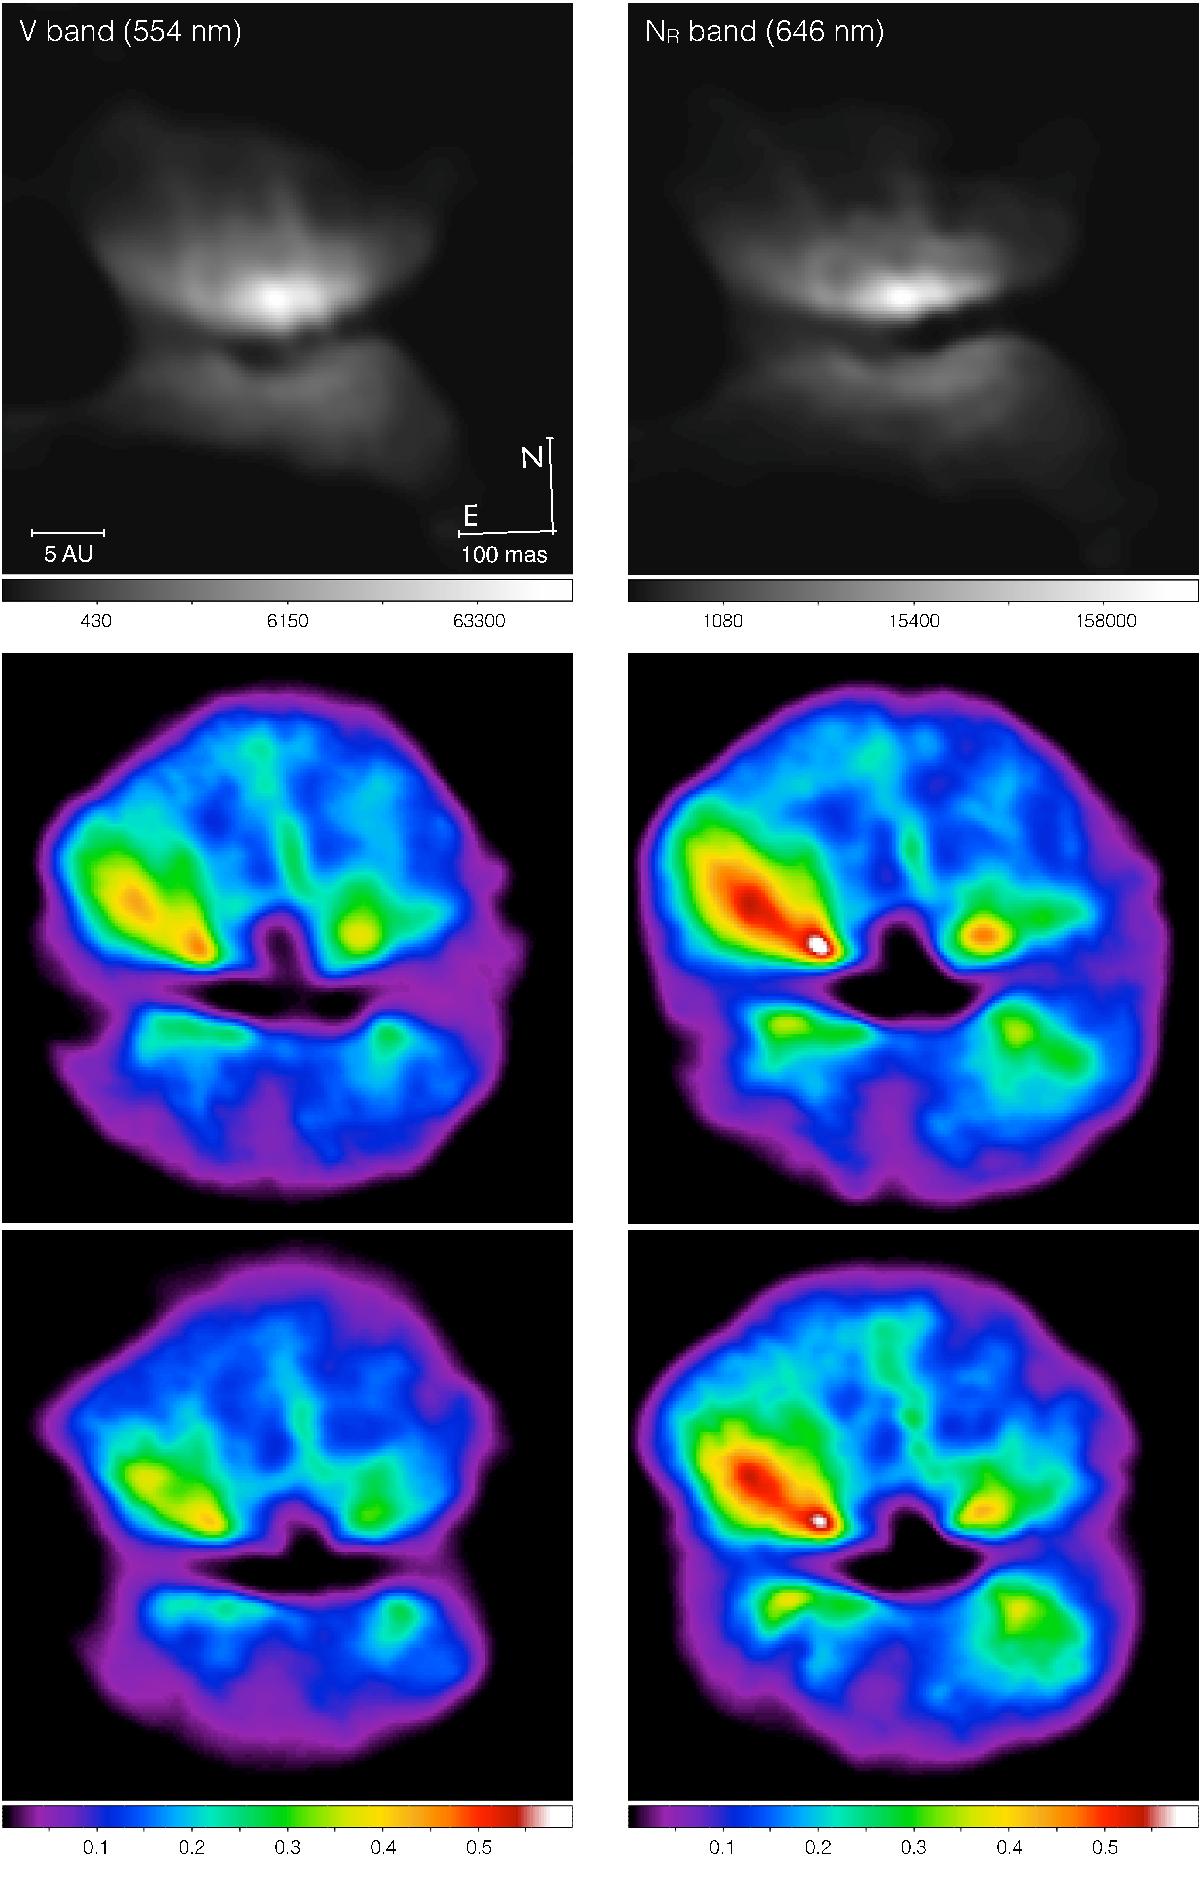
Top: deconvolved intensity images of L2 Pup in the V (left) and NR (right) bands (logarithmic intensity scale, in ADU). Middle: deconvolved map of the degree of linear polarization pL in the V (left) and NR (right) bands from the non-coronagraphic observations (linear intensity scale). Bottom: pL in the V (left) and NR (right) bands from the coronagraphic frames (linear intensity scale). The field of view is 0.60″ × 0.60″.
Current usage metrics show cumulative count of Article Views (full-text article views including HTML views, PDF and ePub downloads, according to the available data) and Abstracts Views on Vision4Press platform.
Data correspond to usage on the plateform after 2015. The current usage metrics is available 48-96 hours after online publication and is updated daily on week days.
Initial download of the metrics may take a while.