Fig. 9
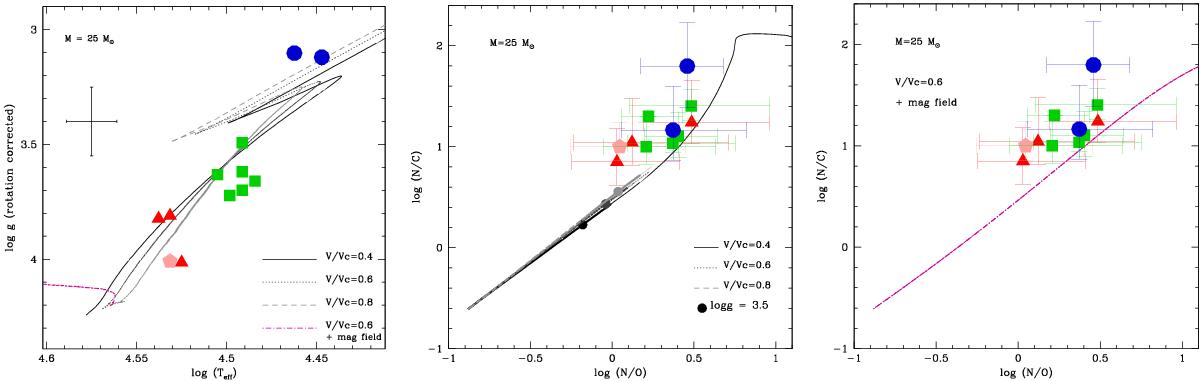
Effect of rotation on a 25 M⊙ evolutionary model. Left: log g−log(Teff) diagram. Middle: log(N/C)−log(N/O) diagram for models at different velocities. Right: log(N/C)−log(N/O) diagram for a model including magnetic field and V/Vc = 0.6. The bold part of the tracks corresponds to the main sequence. Dots in the middle panel correspond to a surface log g= 3.5, i.e. the minimum value for dwarfs and giants in the lefthand panel; in the righthand panel, log g is always higher than 3.5. Models for V/Vc = 0.4 are from Ekström et al. (2012). Models for higher velocities have been computed for the present study with the Geneva code until the red supergiant phase.
Current usage metrics show cumulative count of Article Views (full-text article views including HTML views, PDF and ePub downloads, according to the available data) and Abstracts Views on Vision4Press platform.
Data correspond to usage on the plateform after 2015. The current usage metrics is available 48-96 hours after online publication and is updated daily on week days.
Initial download of the metrics may take a while.