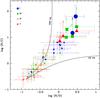
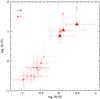
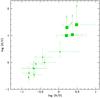
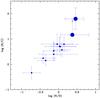
Fig. 6
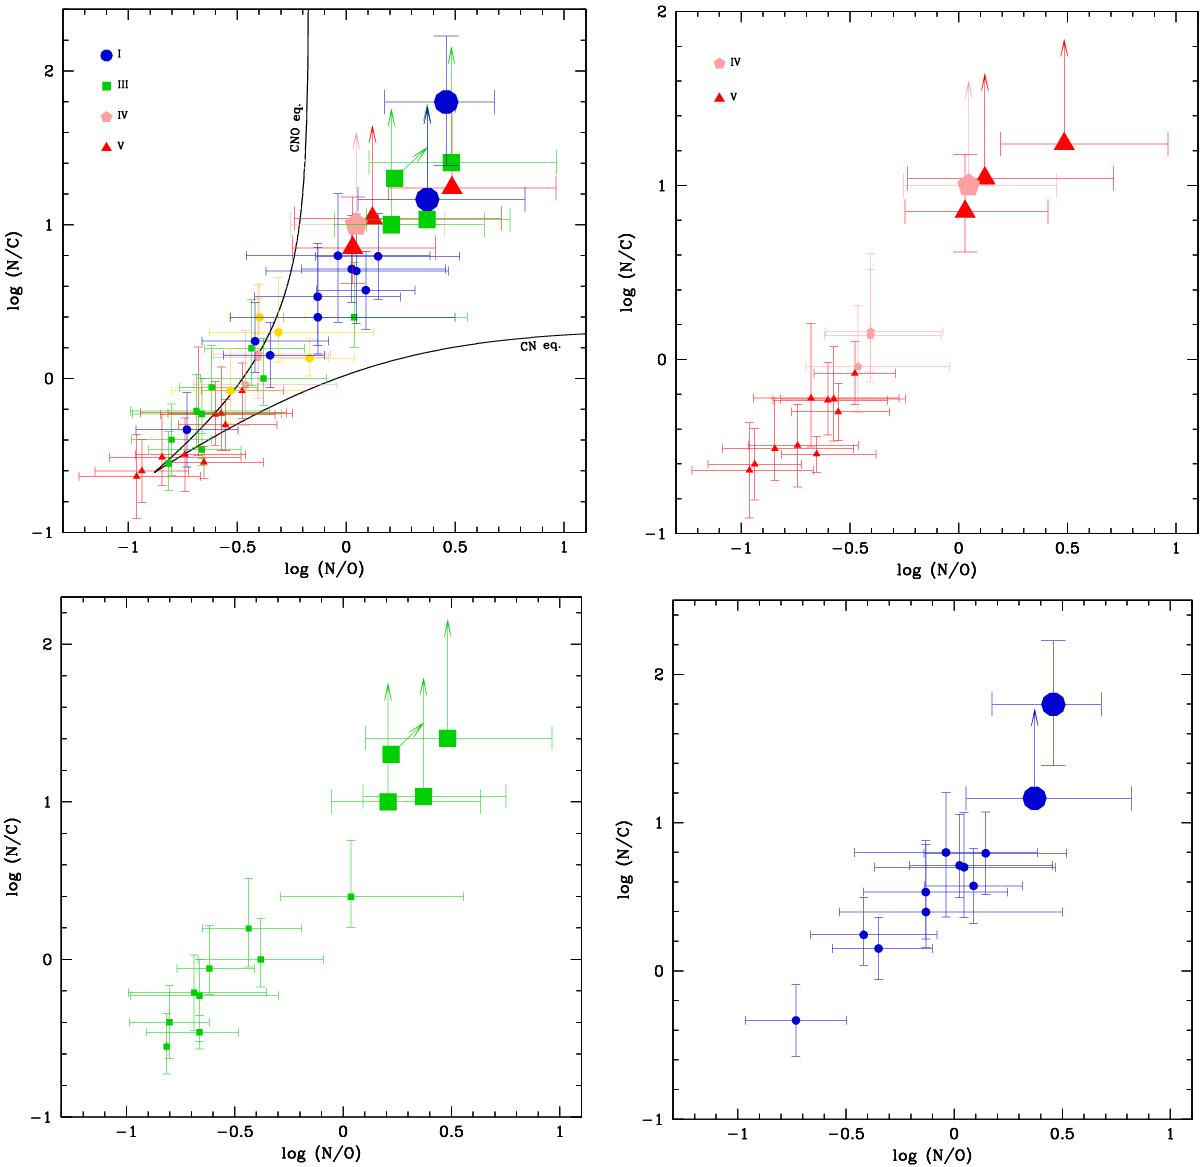
Distributions of log (N/C) versus log(N/O) for the ON stars (large symbols) and for a comparison set of normal O stars with spectral types O8.5−O9.7 (small symbols) taken from Martins et al. (2015). The upper left panel shows the full sample. The upper right (lower left, lower right) shows the dwarf–subgiant (giant, supergiant) sample. Solid lines in the upper left panel show the relations expected for partial CN or complete CNO burning in equilibrium.
Current usage metrics show cumulative count of Article Views (full-text article views including HTML views, PDF and ePub downloads, according to the available data) and Abstracts Views on Vision4Press platform.
Data correspond to usage on the plateform after 2015. The current usage metrics is available 48-96 hours after online publication and is updated daily on week days.
Initial download of the metrics may take a while.