Fig. 4
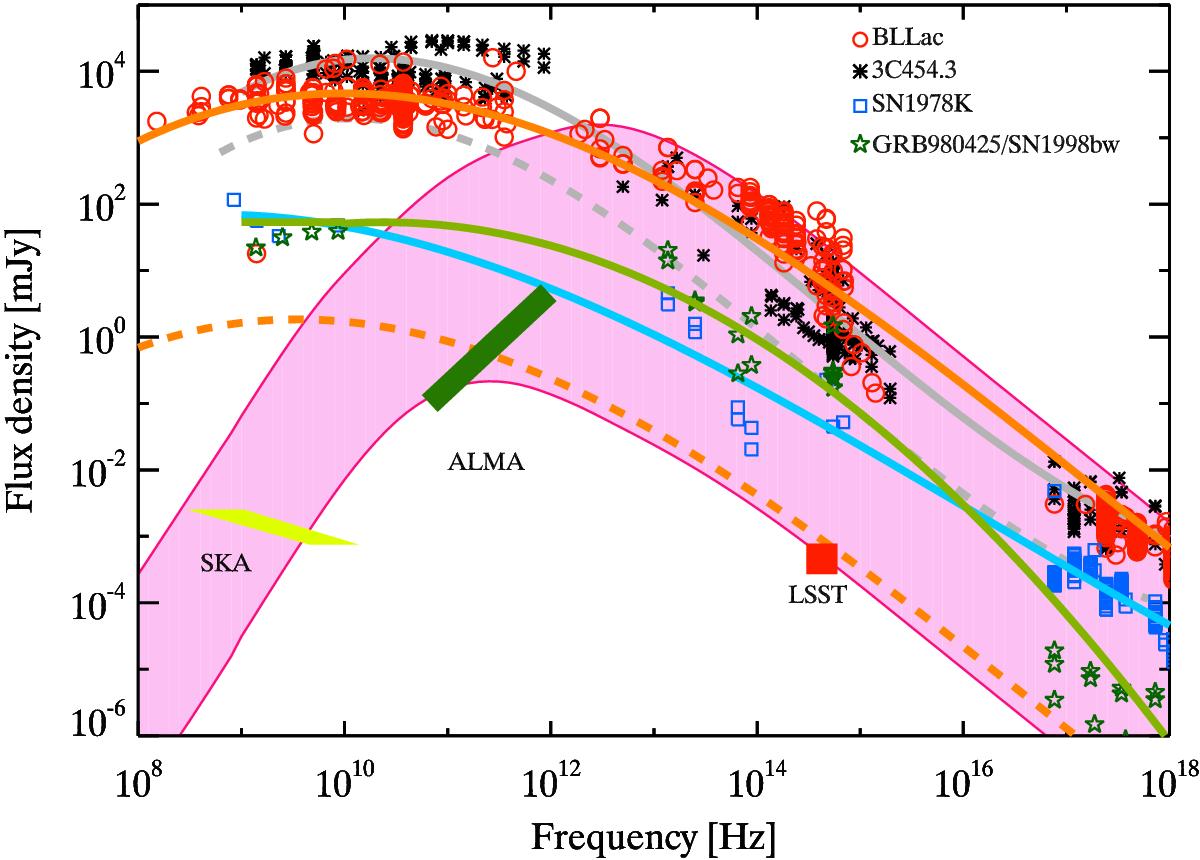
Spectral energy distribution of the OAs that can be detected by the LSST (pink filled region). The SED of the low-power blazar BLLac (open circles), the FSRQ 3C 454.3 (asterisks), and of two supernovae, SN1978K (open squares) and the GRB–SN associated GRB980425/SN1998bw (open stars), are shown with different symbols. The solid lines provide an interpolation of the data points and do not represent any physical model. For the two blazars, we also show, with a dashed gray line for 3C 454.3 and dashed orange line for BLLac, how their spectra would appear if they were at z = 2 (typical of GRBs). The (5σ) limits for a 12 h continuum observation with the SKA is shown by the yellow shaded region. The green shaded region marks the limiting flux of an ALMA observation (32 antennas of 12 m for 3 h of observation in dual mode, from https://almascience.eso.org/proposing/sensitivity-calculator). The LSST limiting flux (see Table 2) is shown by the red square symbol.
Current usage metrics show cumulative count of Article Views (full-text article views including HTML views, PDF and ePub downloads, according to the available data) and Abstracts Views on Vision4Press platform.
Data correspond to usage on the plateform after 2015. The current usage metrics is available 48-96 hours after online publication and is updated daily on week days.
Initial download of the metrics may take a while.