Free Access
Fig. 3
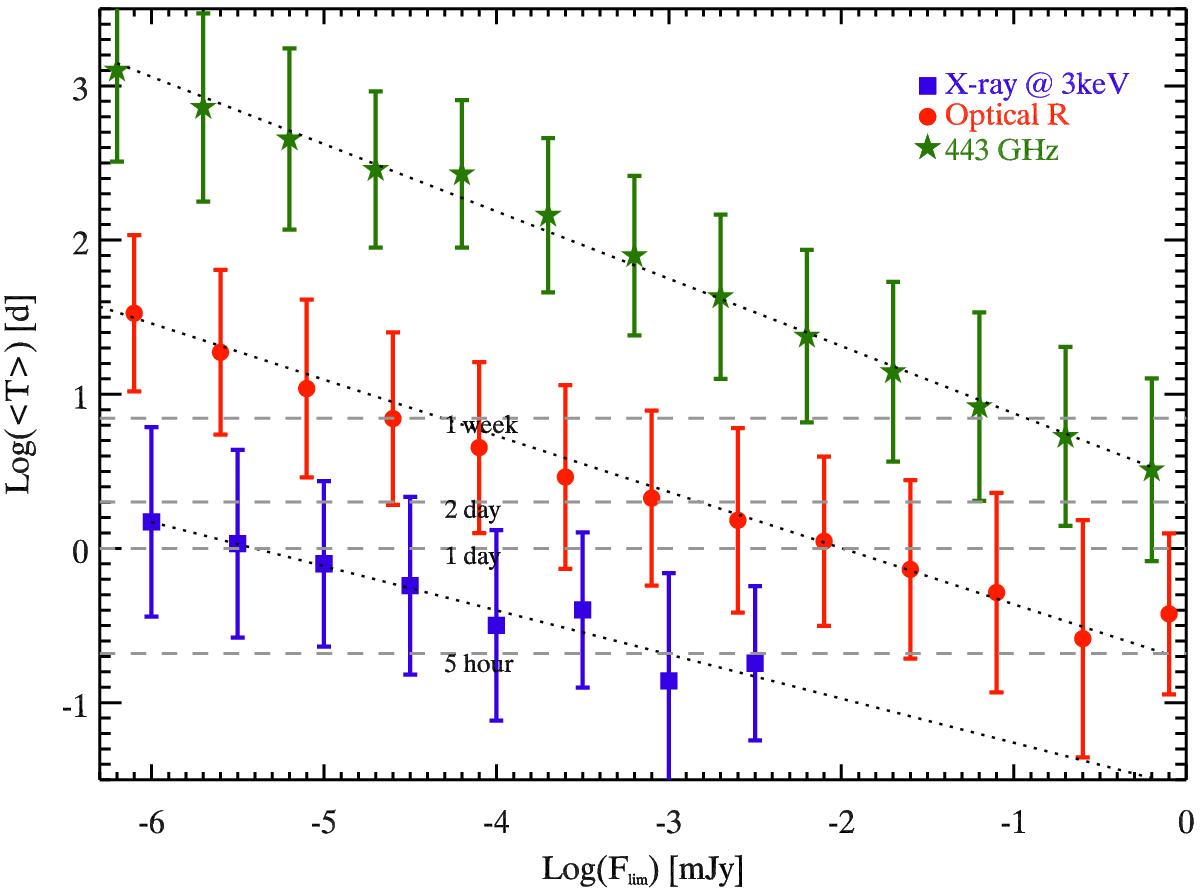
Average duration of the simulated population of OAs with flux above the corresponding x-axis value. The bars represent the 1σ scatter around the average. Typical timescales are shown by the dashed horizontal lines (as labeled). Linear fits are shown by the dotted lines. Fit parameters are reported in Table 1.
Current usage metrics show cumulative count of Article Views (full-text article views including HTML views, PDF and ePub downloads, according to the available data) and Abstracts Views on Vision4Press platform.
Data correspond to usage on the plateform after 2015. The current usage metrics is available 48-96 hours after online publication and is updated daily on week days.
Initial download of the metrics may take a while.