Fig. 2
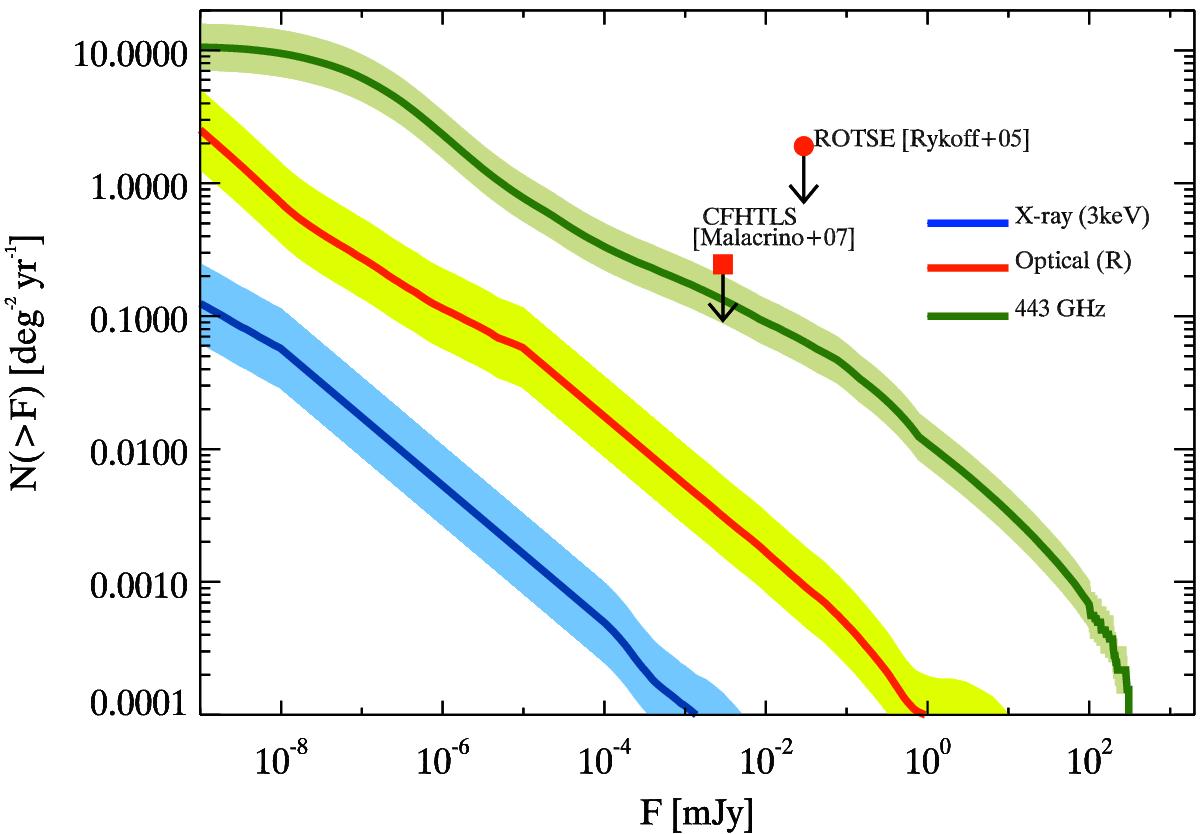
Cumulative flux density distribution of OAs at three characteristic frequencies: R band for the optical (red line), 3 keV for the X-ray (blue line), and 443 GHz for the mm band (green line is representative of ALMA frequency range). Upper limits of past searches of OAs in the optical band are shown by the red symbols (to be compared with the red solid line). The optical R flux distribution is representative of the OAs at z ≤ 4.5 because, at higher redshift, their R band flux suffers from Lyα suppression. An optical extinction (according to the distribution of Covino et al. 2013) has been applied to the optical fluxes.
Current usage metrics show cumulative count of Article Views (full-text article views including HTML views, PDF and ePub downloads, according to the available data) and Abstracts Views on Vision4Press platform.
Data correspond to usage on the plateform after 2015. The current usage metrics is available 48-96 hours after online publication and is updated daily on week days.
Initial download of the metrics may take a while.