Fig. 1
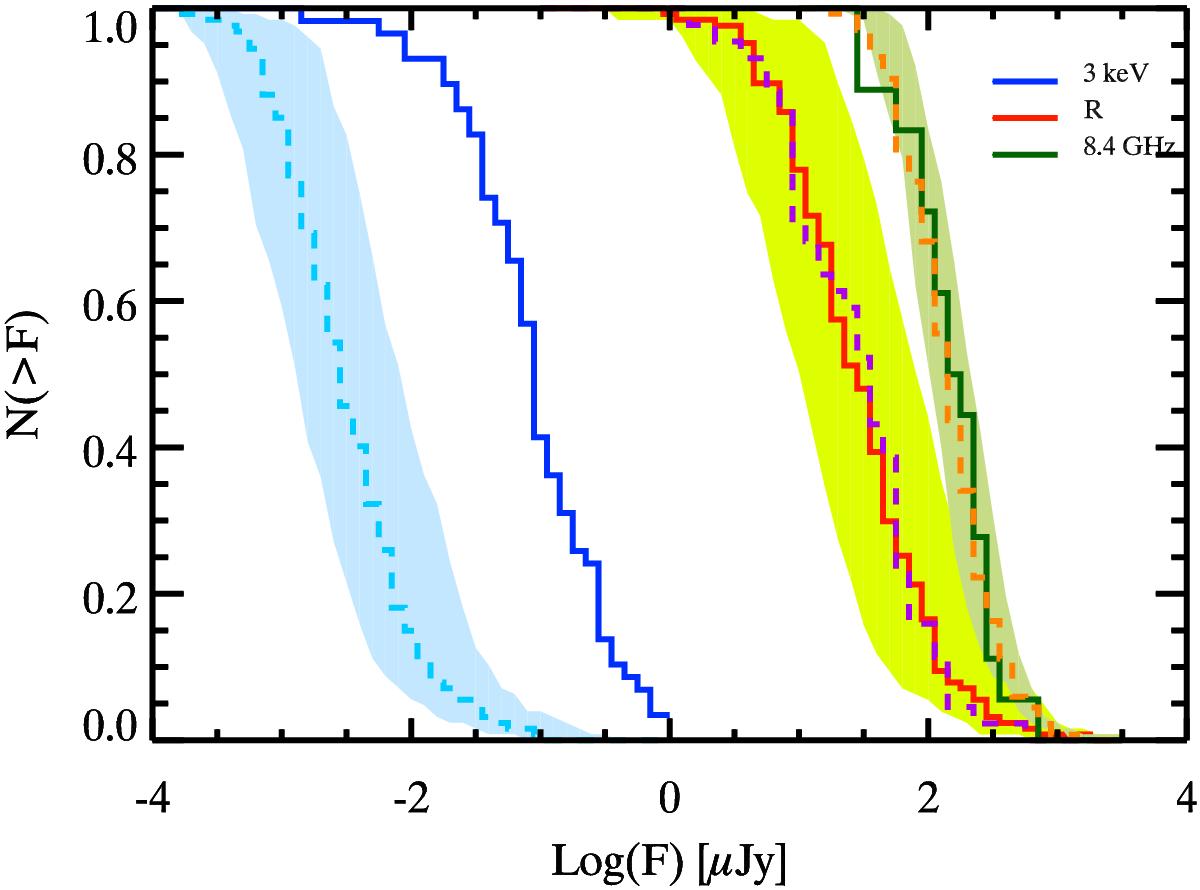
Flux density cumulative distributions in the optical (R , solid red line), X-ray (at 3 keV, solid blue line) computed at 11 h after the start of the GRB emission for the BAT6 Swift complete sample (adapted from Melandri et al. 2014; and D’Avanzo et al. 2012, for the optical and X-ray band, respectively). The radio (at 8.4 GHz – solid green line) is from Ghirlanda et al. (2013b), also for the BAT6 sample. The results of the population synthesis code with p = 2.3,ϵe = 0.02 and ϵB = 0.008 are shown with the dashed lines. The shaded regions represent, for each band, the results obtained with (p,ϵe,ϵB) = (2.3,0.01,0.001) for the lower boundary and (p,ϵe,ϵB) = (2.3,0.05,0.01) for the upper boundary. The X-ray and R band fluxes of the Swift BAT6 sample (solid blue and red line respectively) have been corrected for absorption (D’Avanzo et al. 2012; Campana et al. 2012) and for dust extinction (Melandri et al. 2014; Covino et al. 2013), respectively.
Current usage metrics show cumulative count of Article Views (full-text article views including HTML views, PDF and ePub downloads, according to the available data) and Abstracts Views on Vision4Press platform.
Data correspond to usage on the plateform after 2015. The current usage metrics is available 48-96 hours after online publication and is updated daily on week days.
Initial download of the metrics may take a while.