Fig. 3
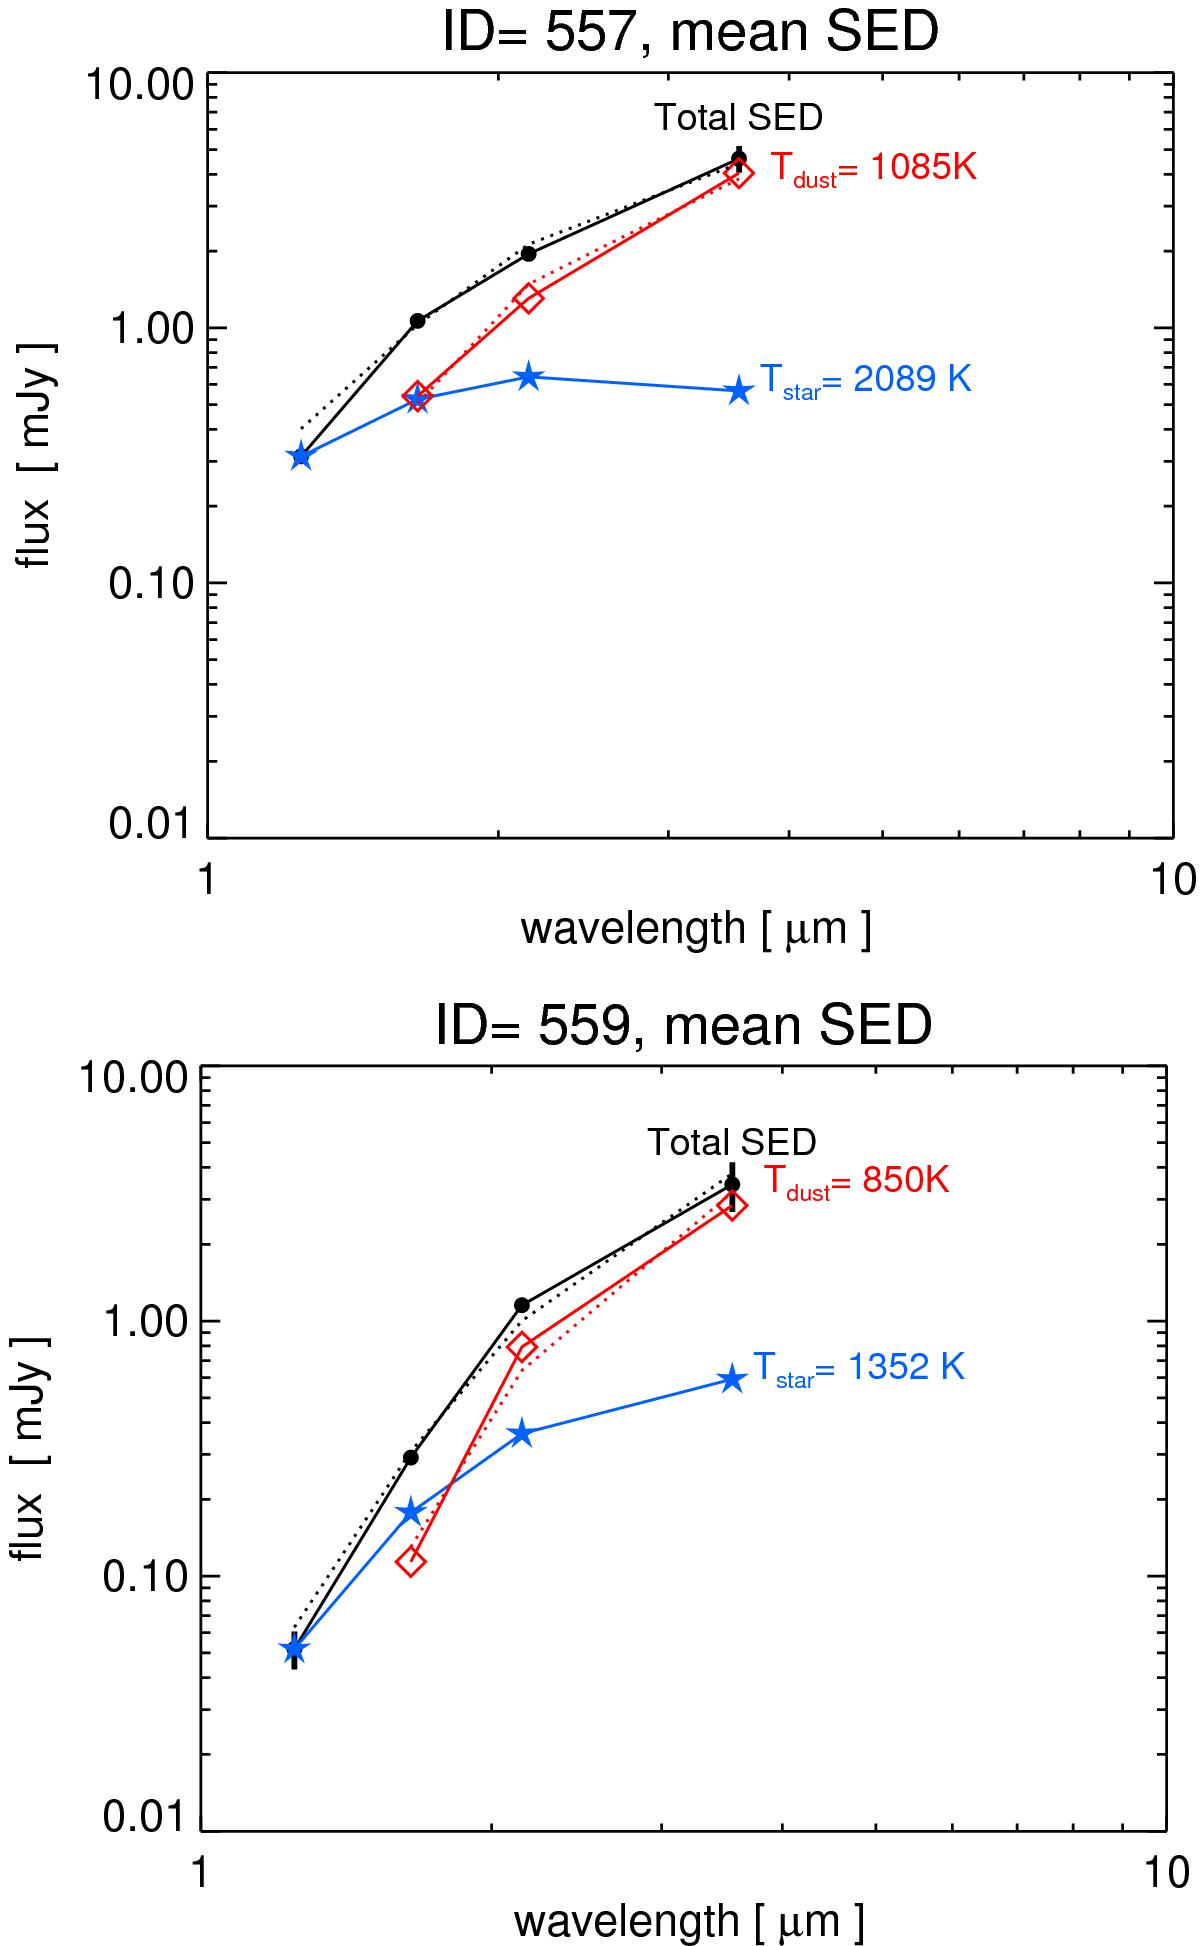
Mean spectral energy distributions of ID 557 and 559. The total SED (black) is decomposed into a star (blue) and a circumstellar disk (red). The color temperature of the star is identified with Tvar as determined from the FVG analysis (Fig. 2). The star’s maximum possible mean flux is constrained by the lowest total SED, here the J band flux. The remaining SED (total minus star, depicted as red diamonds and connected by red solid lines) is fitted by a blackbody (red dotted line). The sum of the star and the CSD blackbody yields the “modeled” total SED (black dotted lines).
Current usage metrics show cumulative count of Article Views (full-text article views including HTML views, PDF and ePub downloads, according to the available data) and Abstracts Views on Vision4Press platform.
Data correspond to usage on the plateform after 2015. The current usage metrics is available 48-96 hours after online publication and is updated daily on week days.
Initial download of the metrics may take a while.