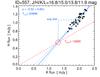
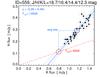
Fig. 2

Flux − flux diagram of quasi-simultaneous H vs. K measurements taken with a time separation of less than two hours (black dots with error bars). The data are linearly fit by the blue solid line, with an uncertainty range indicated by the blue dotted lines. The fit parameters are labeled in the upper left corner. The red long-dashed line and the red circle show the constraints for an additional non-varying CSD, derived from the color temperature Tvar of the varying star and the mean SEDs shown in Fig. 3. The blue dash-dotted lines mark the average H and K flux of the star, given by the difference between the black and red circles.
Current usage metrics show cumulative count of Article Views (full-text article views including HTML views, PDF and ePub downloads, according to the available data) and Abstracts Views on Vision4Press platform.
Data correspond to usage on the plateform after 2015. The current usage metrics is available 48-96 hours after online publication and is updated daily on week days.
Initial download of the metrics may take a while.