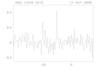
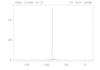
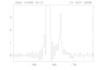
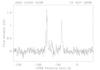
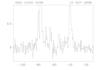
Fig. 1
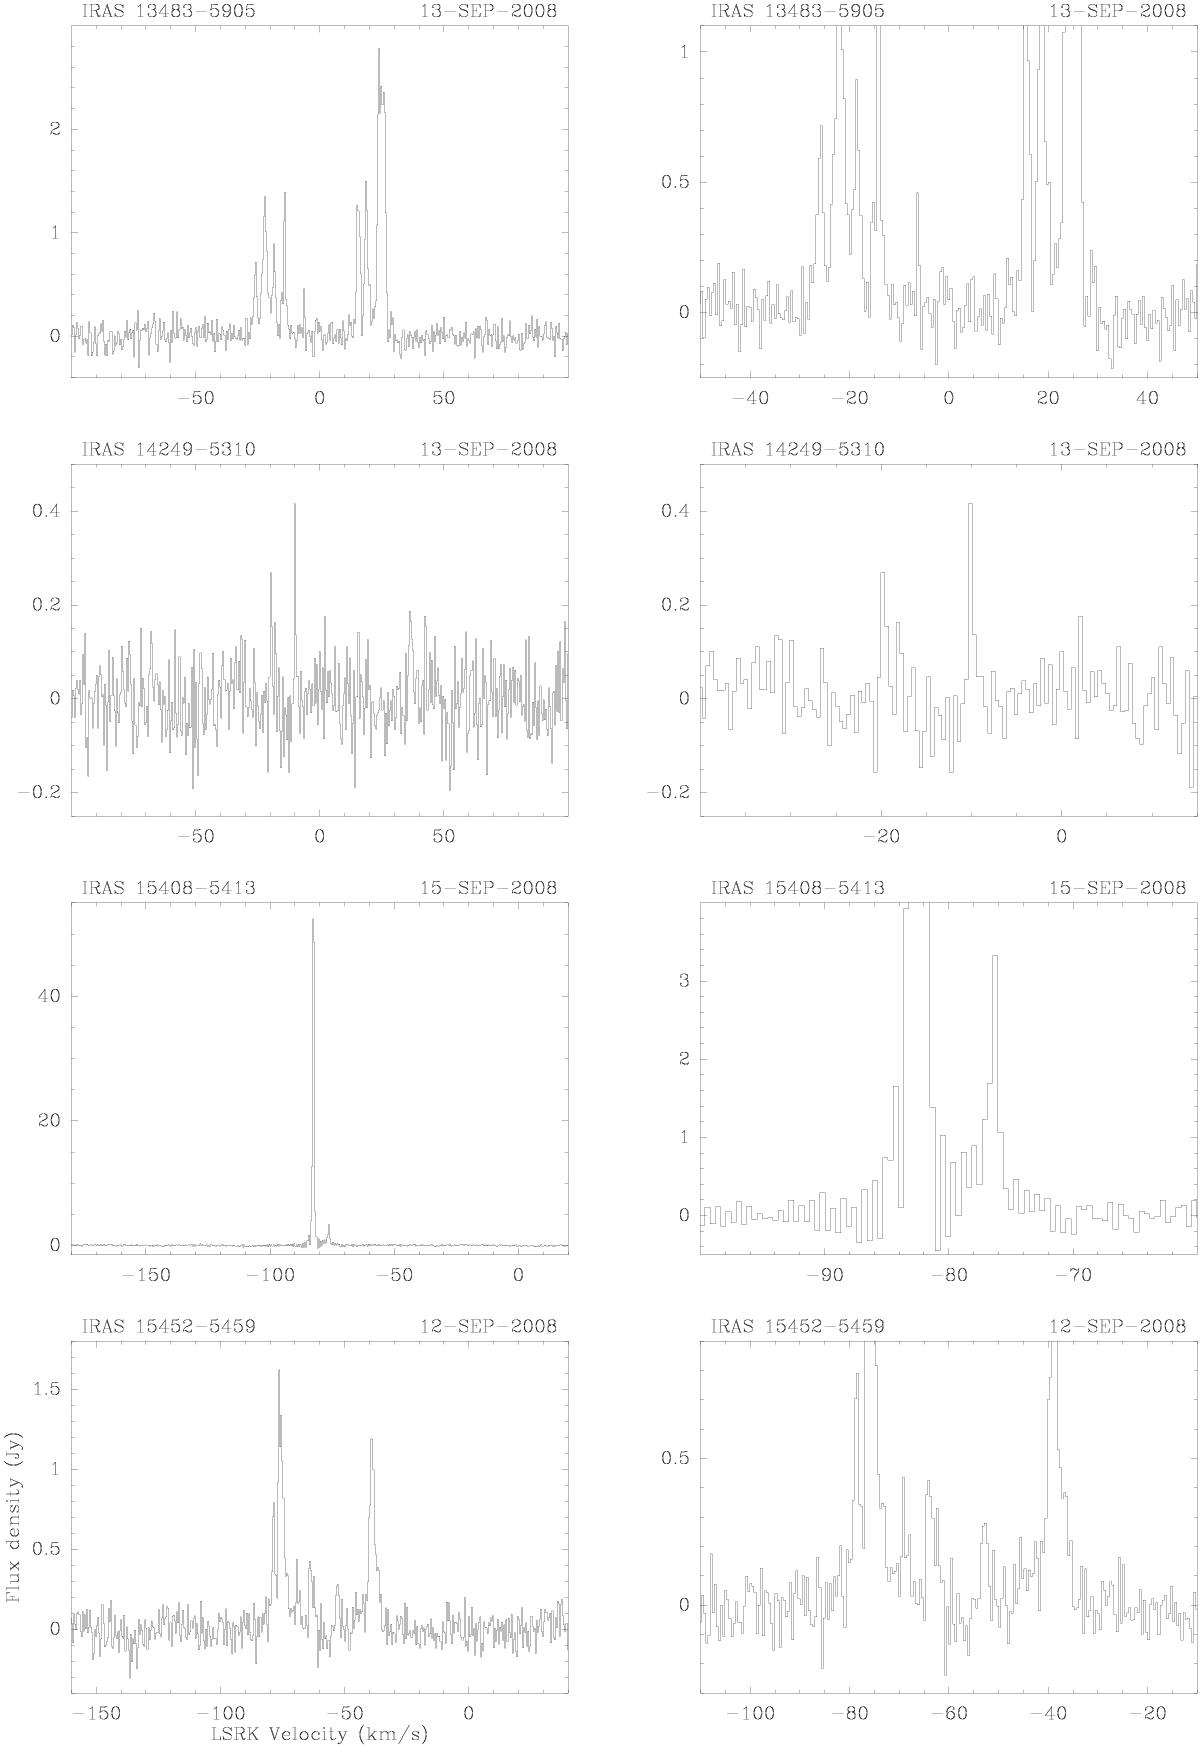
Water maser spectra of the detected sources. Note that some objects were observed more than once. The x-axis is the velocity with respect to the local standard of rest (kinematical definition) in km s-1, and the y-axis is flux density in Jansky. The spectra in the left column show the full scale in flux density, and a range of 200 km s-1 in velocity (except in the case of IRAS 18113−2503, which is shown with a velocity range of 600 km s-1). The spectra in the right column are the same as the corresponding ones in the left column, but with a restricted scale in flux density and/or velocity, to better show weak or narrow spectral features.
Current usage metrics show cumulative count of Article Views (full-text article views including HTML views, PDF and ePub downloads, according to the available data) and Abstracts Views on Vision4Press platform.
Data correspond to usage on the plateform after 2015. The current usage metrics is available 48-96 hours after online publication and is updated daily on week days.
Initial download of the metrics may take a while.