Fig. 5
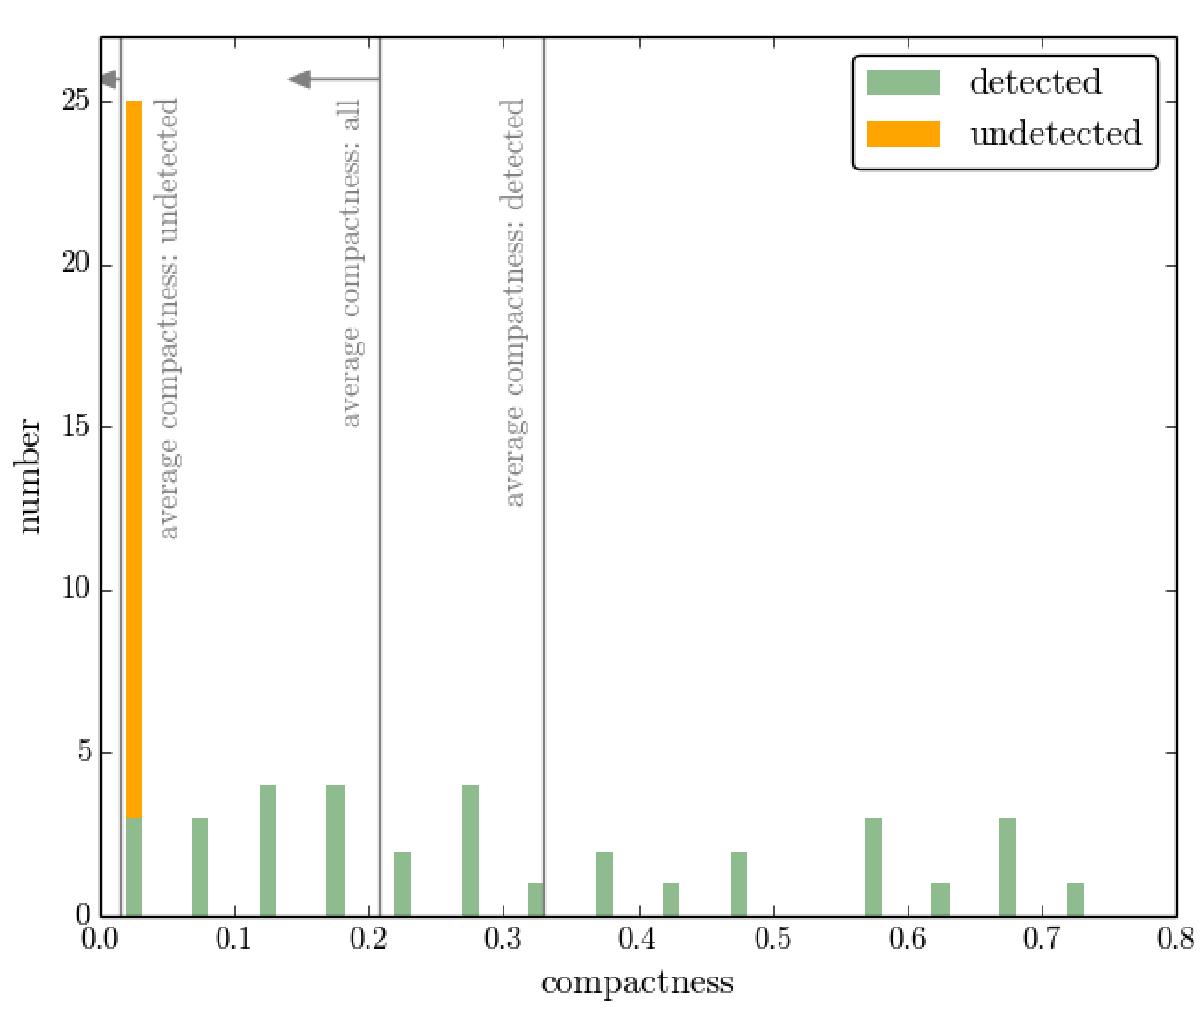
Histogram of the VLBA detections and non-detections, binned in the compactness at 1.4 GHz. Compactness is defined as the ratio of mas-scale flux density to arcsec-scale flux density. The vertical lines show the mean compactness – from left to right – of all VLBA-undetected IFRS, of all VLBA-observed IFRS, and of all VLBA-detected IFRS, respectively. The former two lines represent upper limits as indicated by the horizontal arrows.
Current usage metrics show cumulative count of Article Views (full-text article views including HTML views, PDF and ePub downloads, according to the available data) and Abstracts Views on Vision4Press platform.
Data correspond to usage on the plateform after 2015. The current usage metrics is available 48-96 hours after online publication and is updated daily on week days.
Initial download of the metrics may take a while.