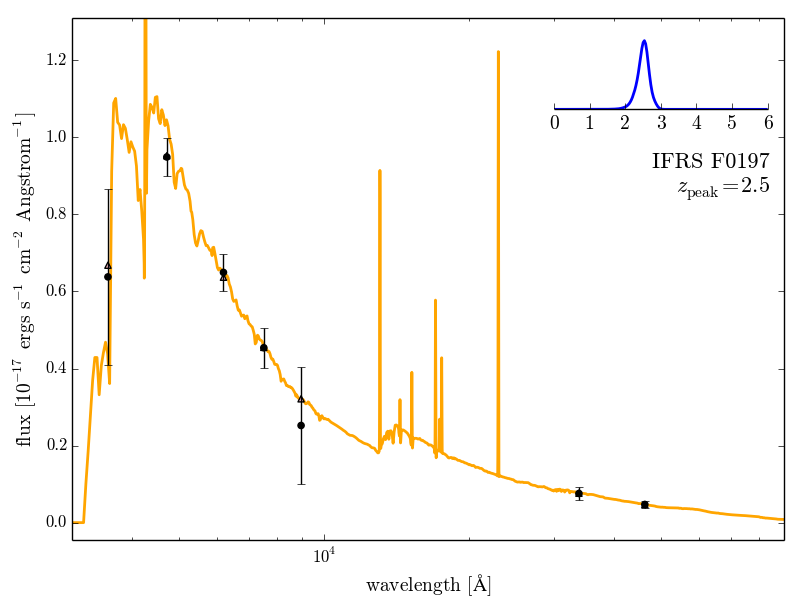
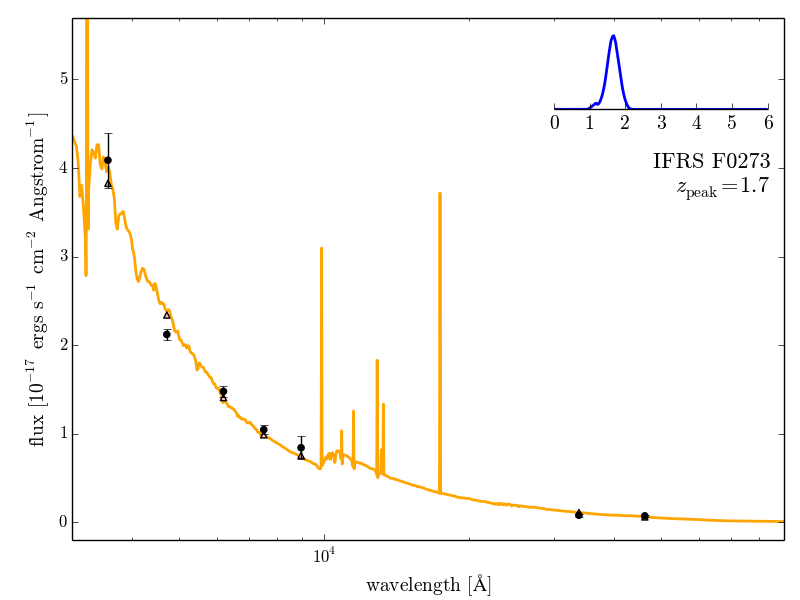
Fig. 2
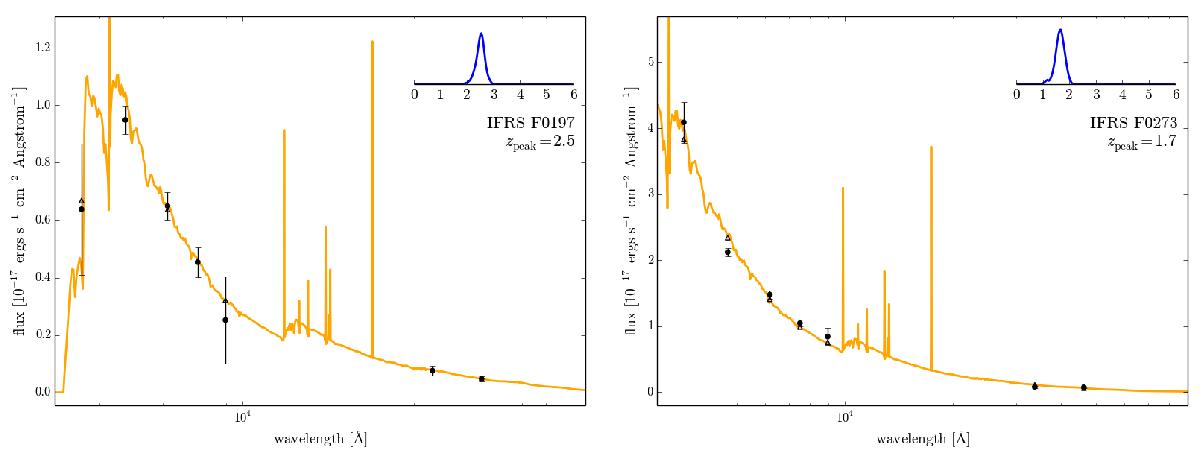
Resulting photometric redshift fit from EAZY for IFRS F0197 (left) and F0273 (right). The SED (orange line) shows the best fit template based on the peak redshift in the observer’s frame. Black dots with error bars represent photometric data points of the IFRS, whereas black triangles show the flux density of the fitted SED at the same wavelengths. The subplots in the upper right of both plots show the redshift-probability distribution. The redshift of the peak in the probability distribution is quoted below each subplot.
Current usage metrics show cumulative count of Article Views (full-text article views including HTML views, PDF and ePub downloads, according to the available data) and Abstracts Views on Vision4Press platform.
Data correspond to usage on the plateform after 2015. The current usage metrics is available 48-96 hours after online publication and is updated daily on week days.
Initial download of the metrics may take a while.