Fig. 4
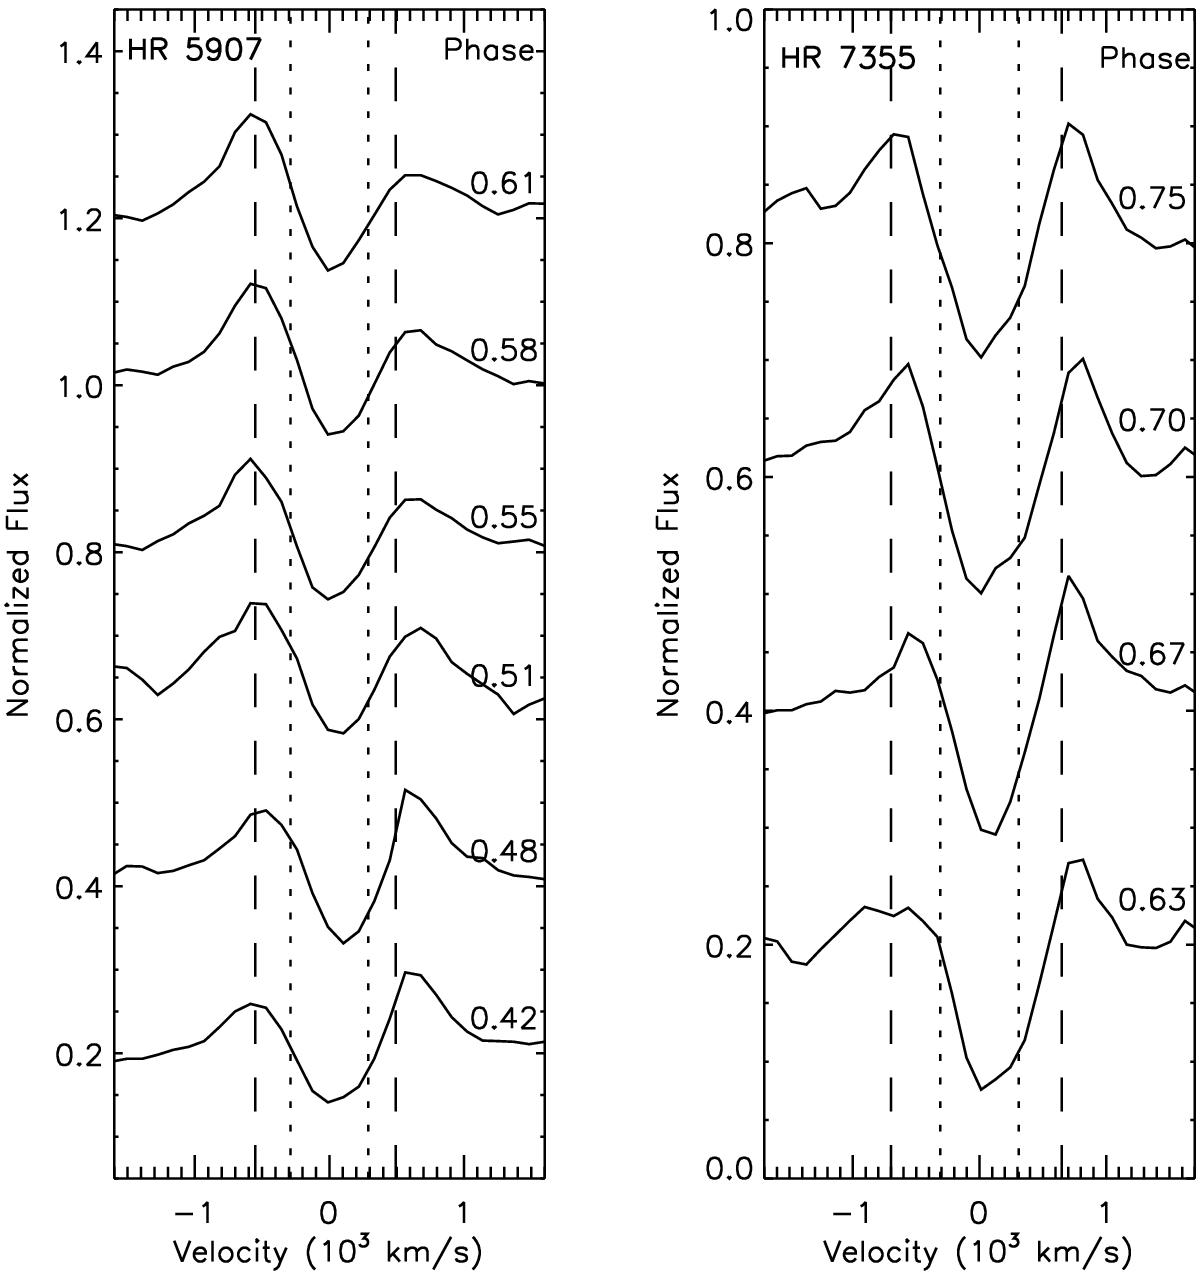
Time-series of the Br10 line of HR 5907 (left) and HR 7355 (right). Stellar rotational phases for each spectrum are indicated to the right. The dotted lines indicate stellar rotation velocities derived from optical spectroscopy, while dashed lines indicate the peak emission found for Hα (Grunhut et al. 2012; Rivinius et al. 2013).
Current usage metrics show cumulative count of Article Views (full-text article views including HTML views, PDF and ePub downloads, according to the available data) and Abstracts Views on Vision4Press platform.
Data correspond to usage on the plateform after 2015. The current usage metrics is available 48-96 hours after online publication and is updated daily on week days.
Initial download of the metrics may take a while.