Fig. 2
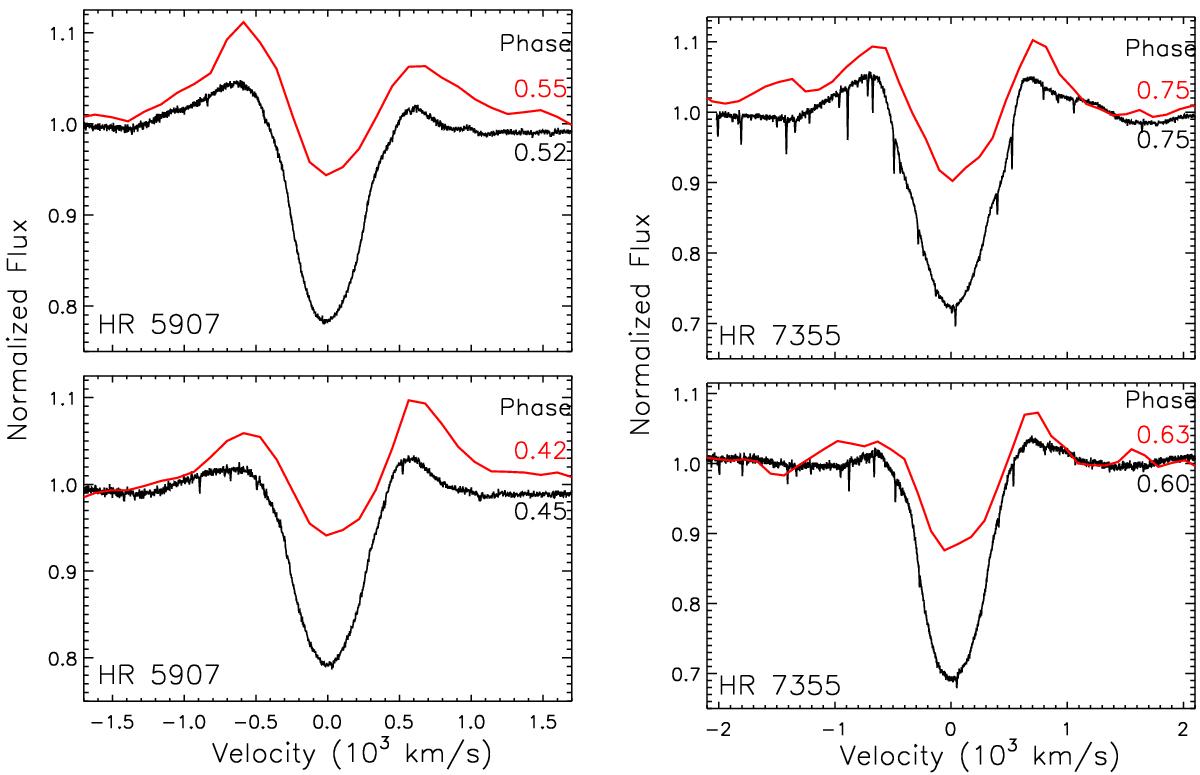
Comparison of optical (Hα, black) and IR (Br10, red) spectral features. Left: HR 5907 at two different rotational phases, ~0.45 and ~0.55 (phases noted to the right). These two phases occur just before and just after the Hα emission maximum (Grunhut et al. 2012). Right: HR 7355 at phases ~0.60 and ~0.75. A peak in Hα emission occurs at phase 0.78 (Rivinius et al. 2013).
Current usage metrics show cumulative count of Article Views (full-text article views including HTML views, PDF and ePub downloads, according to the available data) and Abstracts Views on Vision4Press platform.
Data correspond to usage on the plateform after 2015. The current usage metrics is available 48-96 hours after online publication and is updated daily on week days.
Initial download of the metrics may take a while.