Free Access
Fig. 8
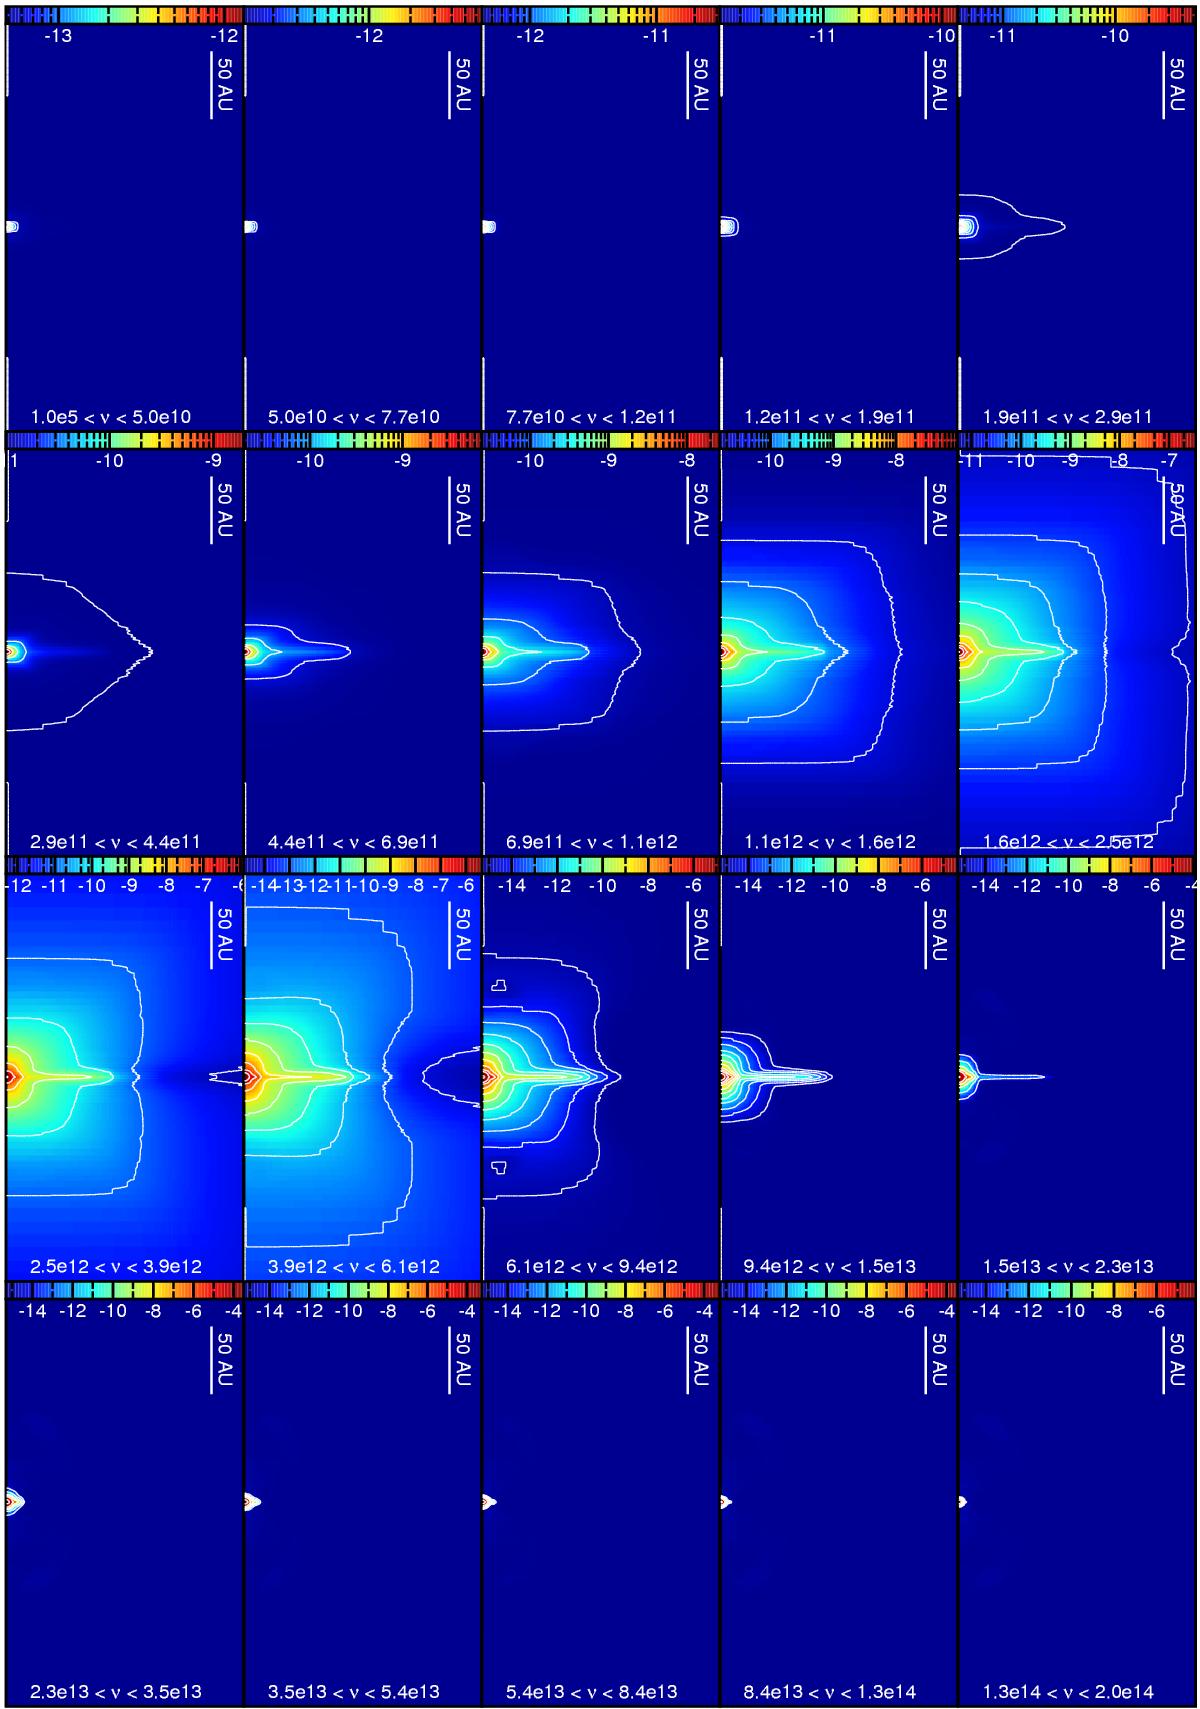
Radiative energy density map in each frequency group. The white contours have 10 levels logarithmically spaced between the minimum and maximum values of each map. The frequencies of each group are indicated at the bottom of each map. The maps represent the same region as in Fig. 7.
Current usage metrics show cumulative count of Article Views (full-text article views including HTML views, PDF and ePub downloads, according to the available data) and Abstracts Views on Vision4Press platform.
Data correspond to usage on the plateform after 2015. The current usage metrics is available 48-96 hours after online publication and is updated daily on week days.
Initial download of the metrics may take a while.