Fig. 9
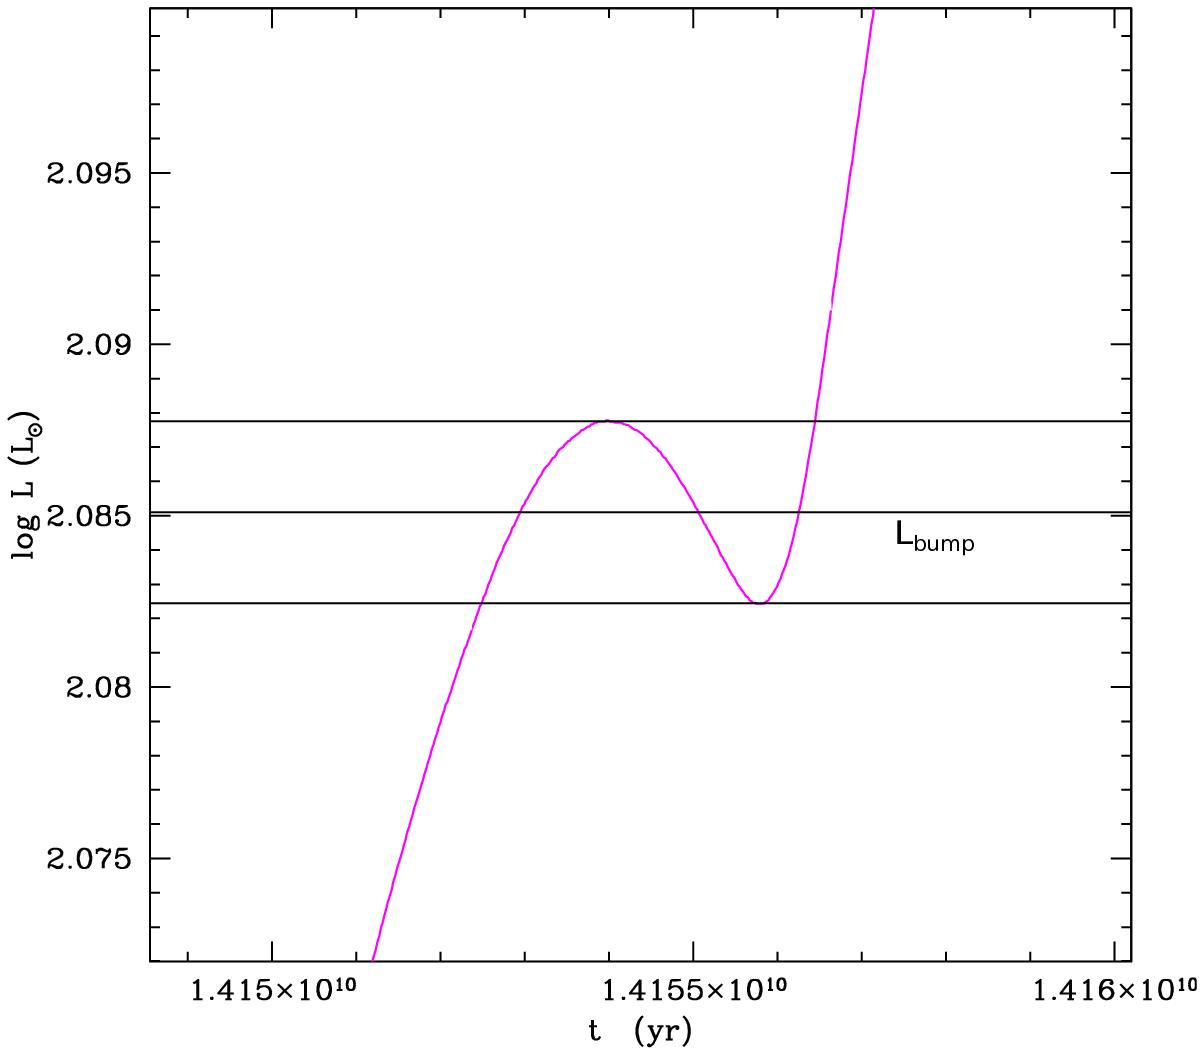
Variations of luminosity during the RGB bump for the 0.8 M⊙ model with Yini = 0.248. The luminosity starts dropping when the H-burning shell encounters the H-abundance discontinuity left behind by the convective envelope during the first dredge-up; it increases again when this discontinuity has been crossed. In Table 2 we give the time the star spends between the lower and upper horizontal lines, as well as the luminosity of the bump indicated by the middle horizontal line.
Current usage metrics show cumulative count of Article Views (full-text article views including HTML views, PDF and ePub downloads, according to the available data) and Abstracts Views on Vision4Press platform.
Data correspond to usage on the plateform after 2015. The current usage metrics is available 48-96 hours after online publication and is updated daily on week days.
Initial download of the metrics may take a while.