Free Access
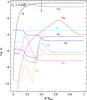
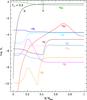
Fig. 7
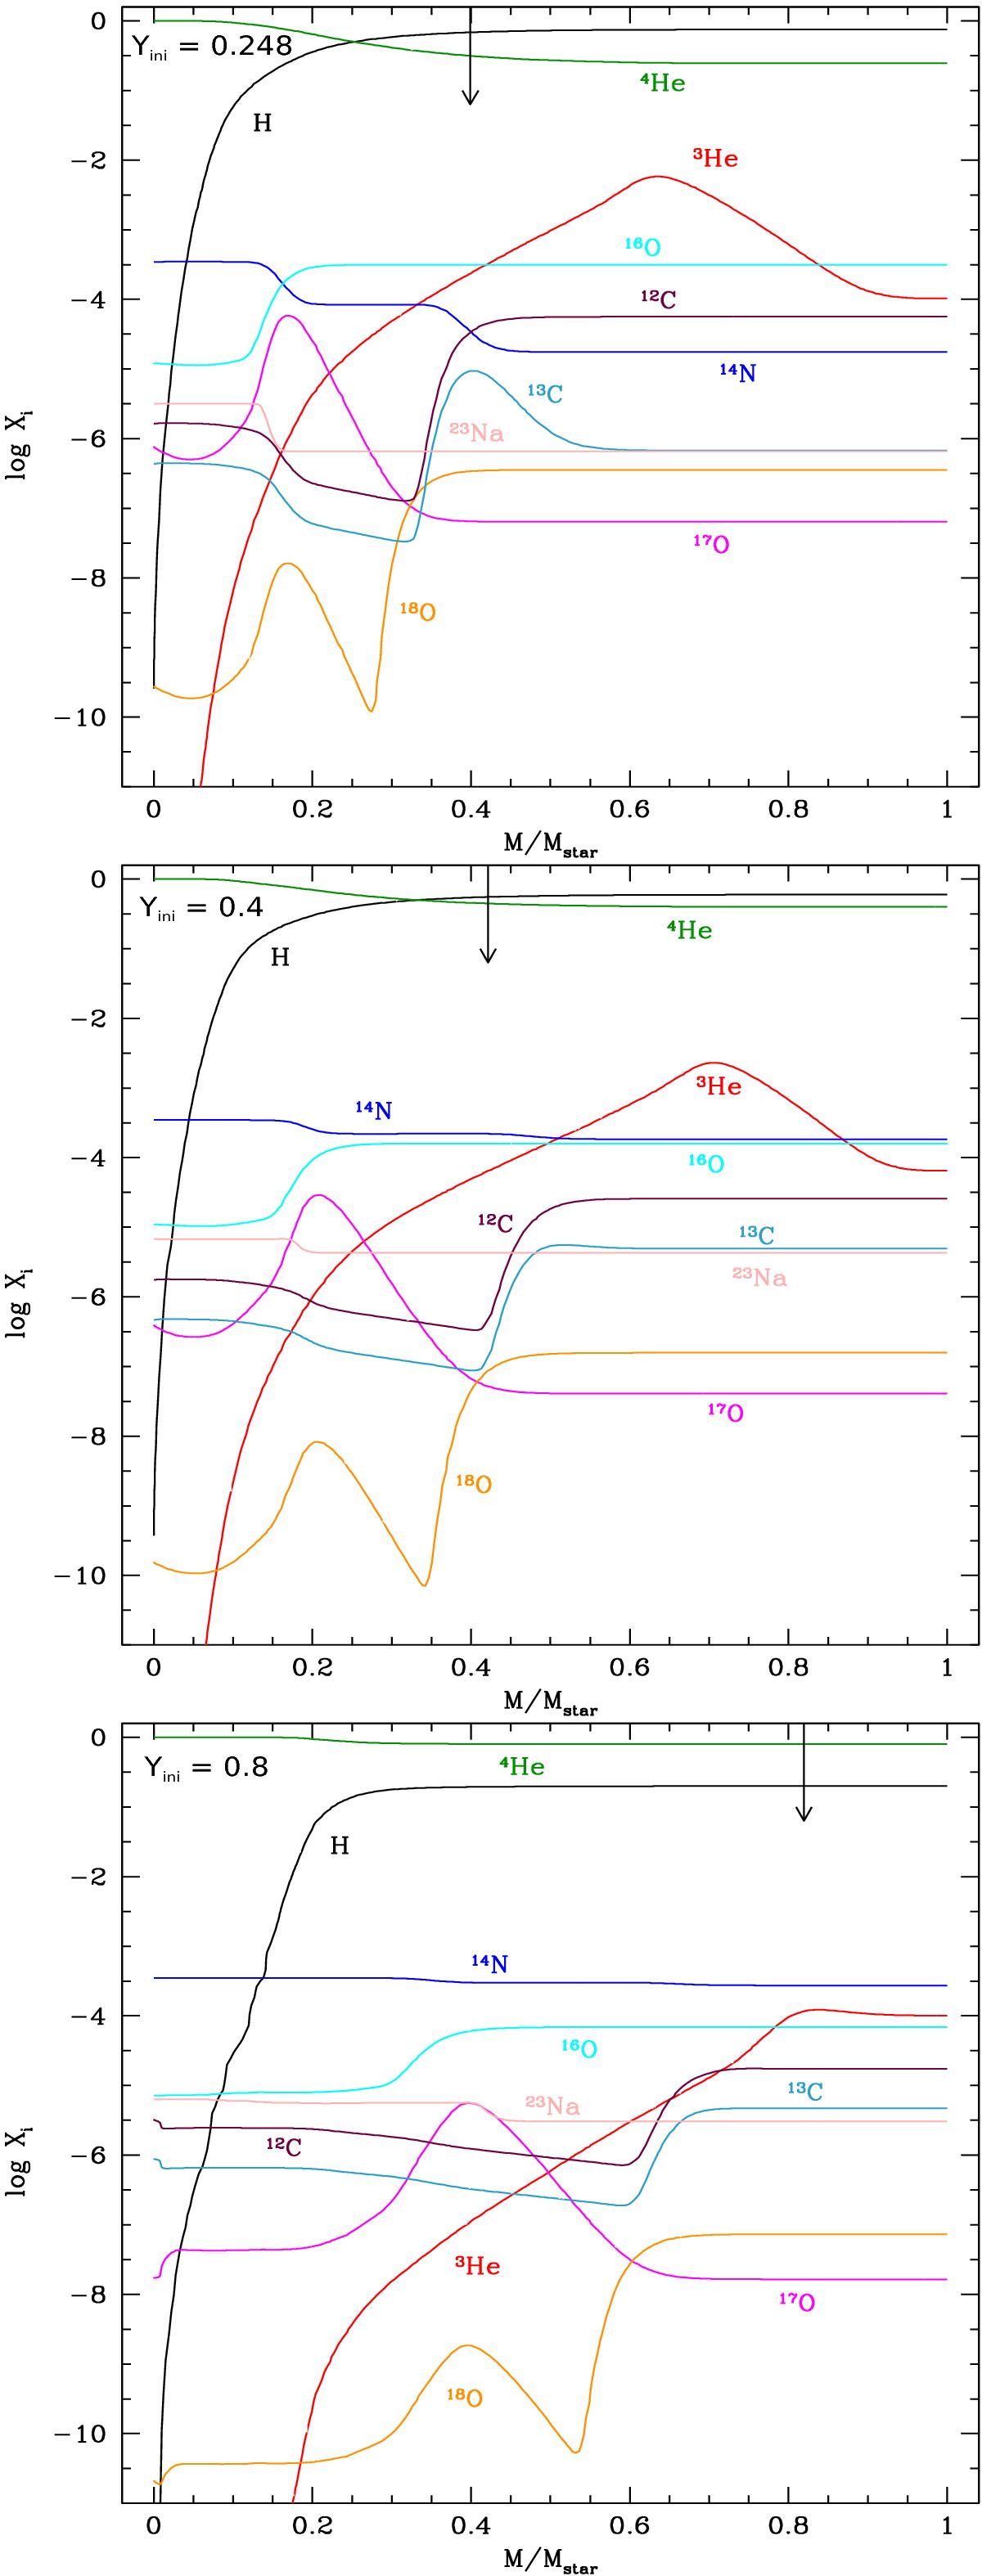
Abundance profiles of the main chemical elements as a function of depth in mass at the end of the main sequence for the 0.8 M⊙ models with Yini = 0.248, 0.4, and 0.8 (top, middle, bottom). The arrows indicate the maximum depth reached by the convective envelope during the first dredge-up on the red giant branch.
This figure is made of several images, please see below:
Current usage metrics show cumulative count of Article Views (full-text article views including HTML views, PDF and ePub downloads, according to the available data) and Abstracts Views on Vision4Press platform.
Data correspond to usage on the plateform after 2015. The current usage metrics is available 48-96 hours after online publication and is updated daily on week days.
Initial download of the metrics may take a while.