Fig. 6
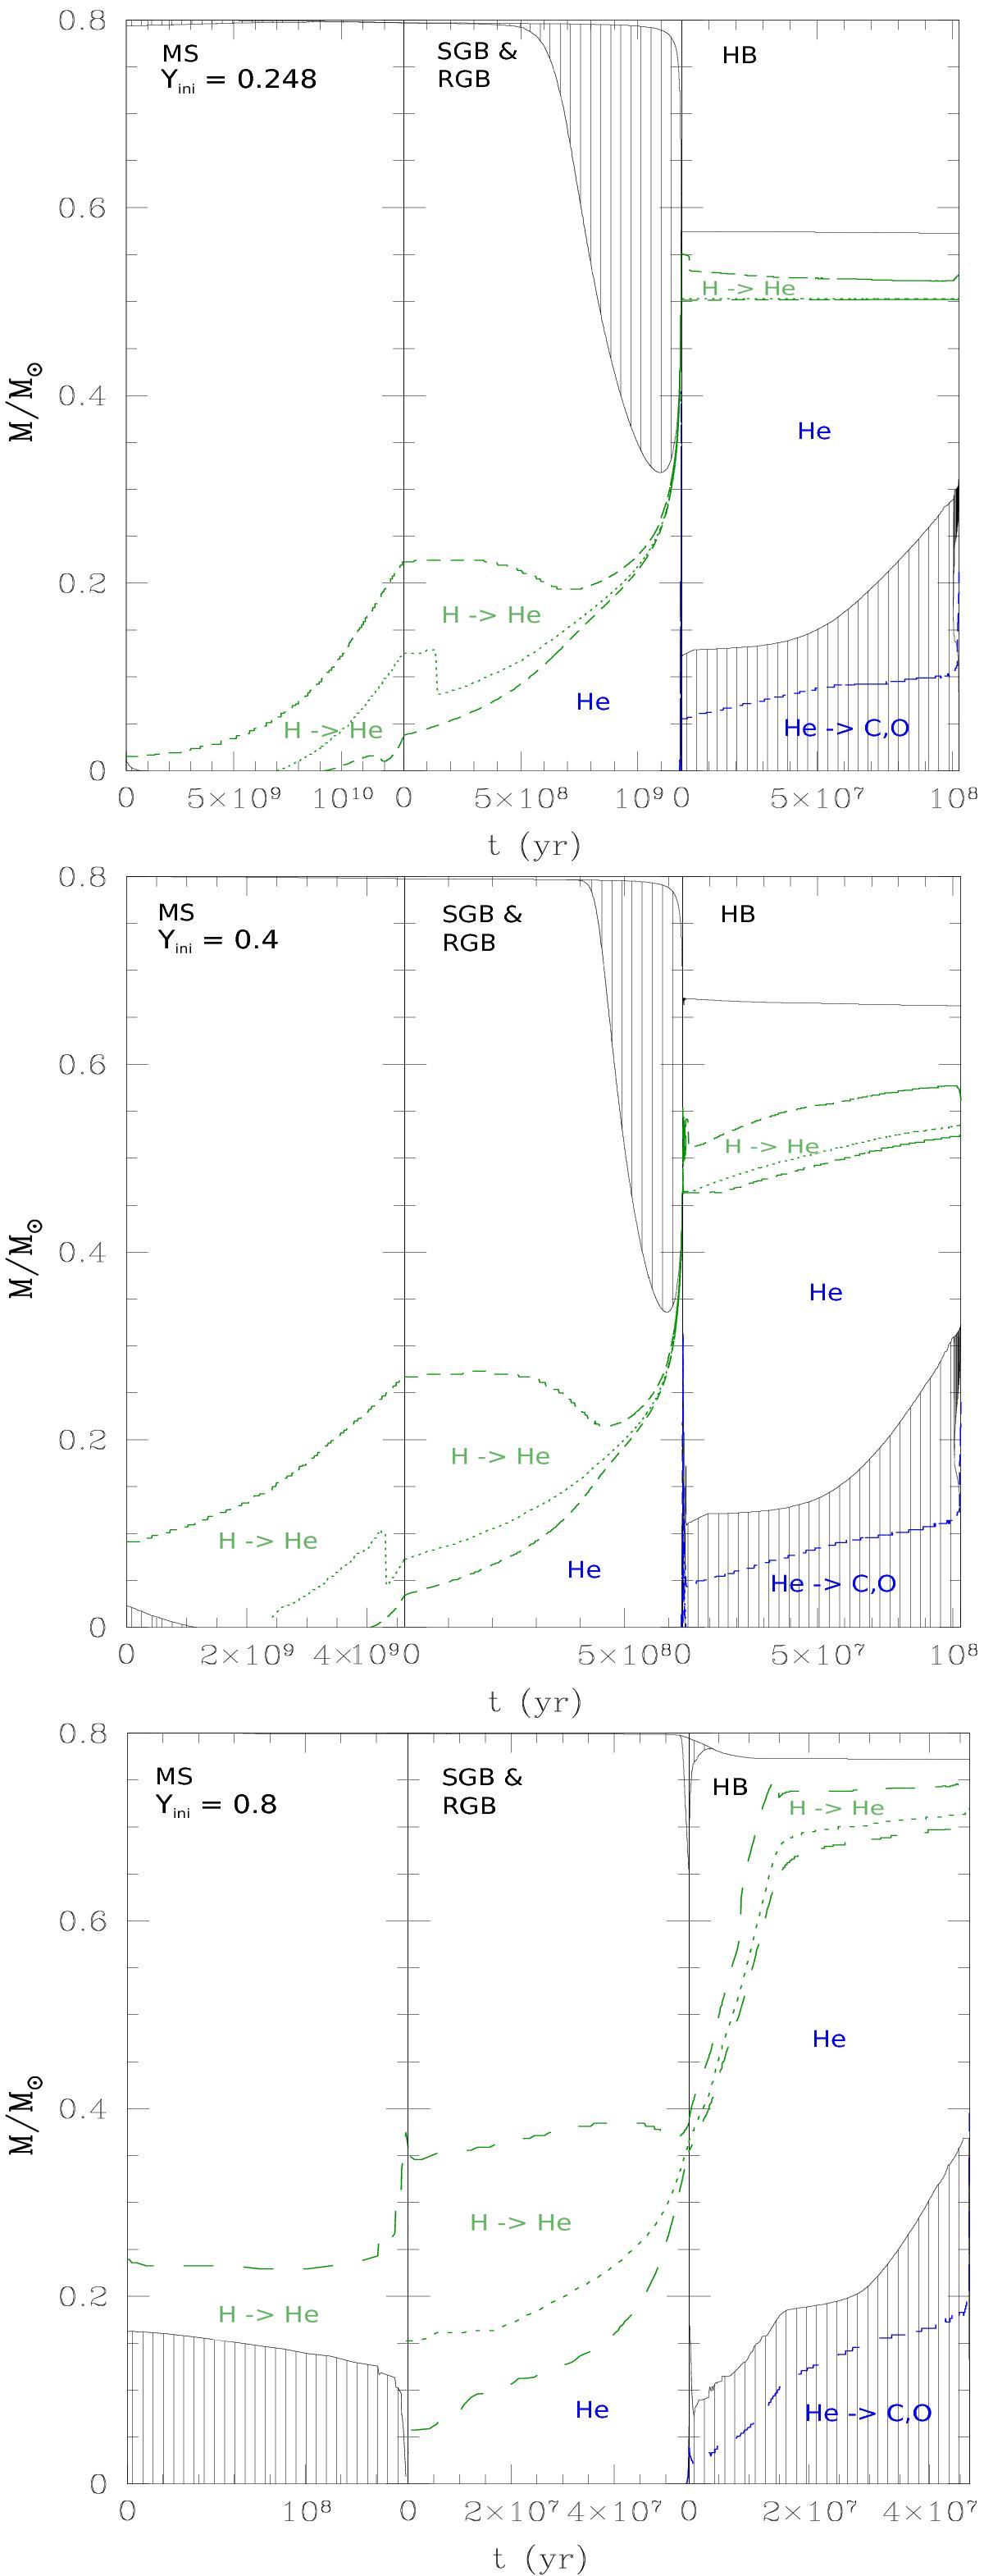
Internal properties (Kippenhahn diagram) of the 0.8 M⊙ models with Yini = 0.248, 0.4, and 0.8 (top, middle, bottom) from the zero age main sequence to the end of central-helium burning. Green dashed lines delimit hydrogen burning regions (≥10 erg g-1 s-1); blue dashed lines delimit the helium burning regions (≥103 erg g-1 s-1); dotted green and blue lines show the maximum energy production of H- and He-burning; hatched areas represent the convective zones. Timescales give the duration of each evolutionary phase.
Current usage metrics show cumulative count of Article Views (full-text article views including HTML views, PDF and ePub downloads, according to the available data) and Abstracts Views on Vision4Press platform.
Data correspond to usage on the plateform after 2015. The current usage metrics is available 48-96 hours after online publication and is updated daily on week days.
Initial download of the metrics may take a while.