Free Access
Fig. 3
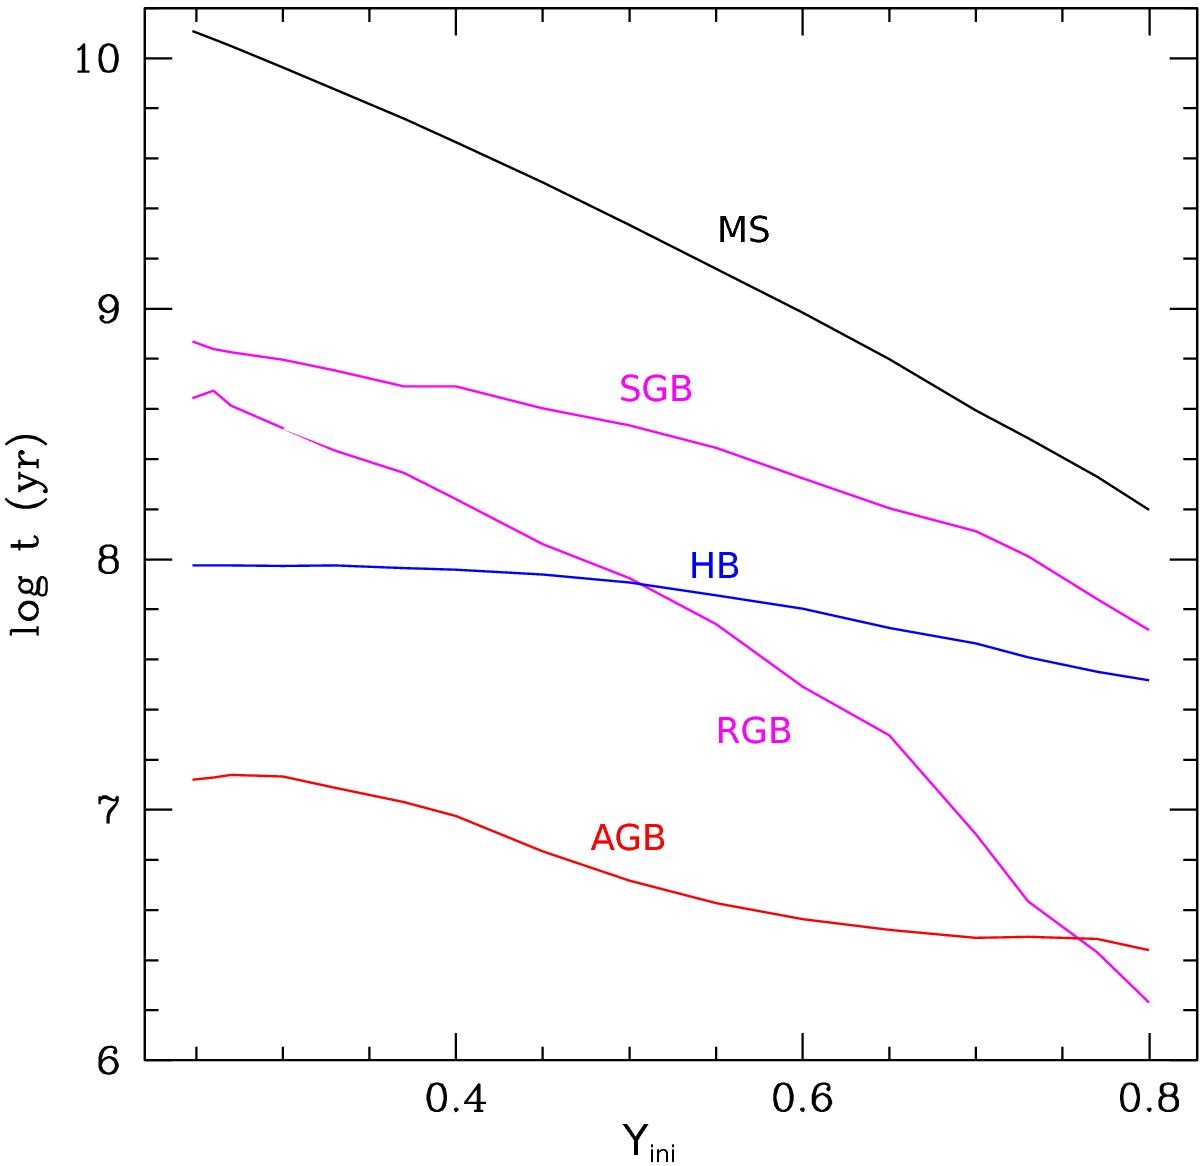
Duration of each evolutionary phase of the 0.8 M⊙ models as a function of their initial helium mass fraction (main sequence, subgiant branch, red giant branch, horizontal branch, and asymptotic giant branch are shown in black, magenta, blue, and red, respectively).
Current usage metrics show cumulative count of Article Views (full-text article views including HTML views, PDF and ePub downloads, according to the available data) and Abstracts Views on Vision4Press platform.
Data correspond to usage on the plateform after 2015. The current usage metrics is available 48-96 hours after online publication and is updated daily on week days.
Initial download of the metrics may take a while.