Free Access
Fig. 1
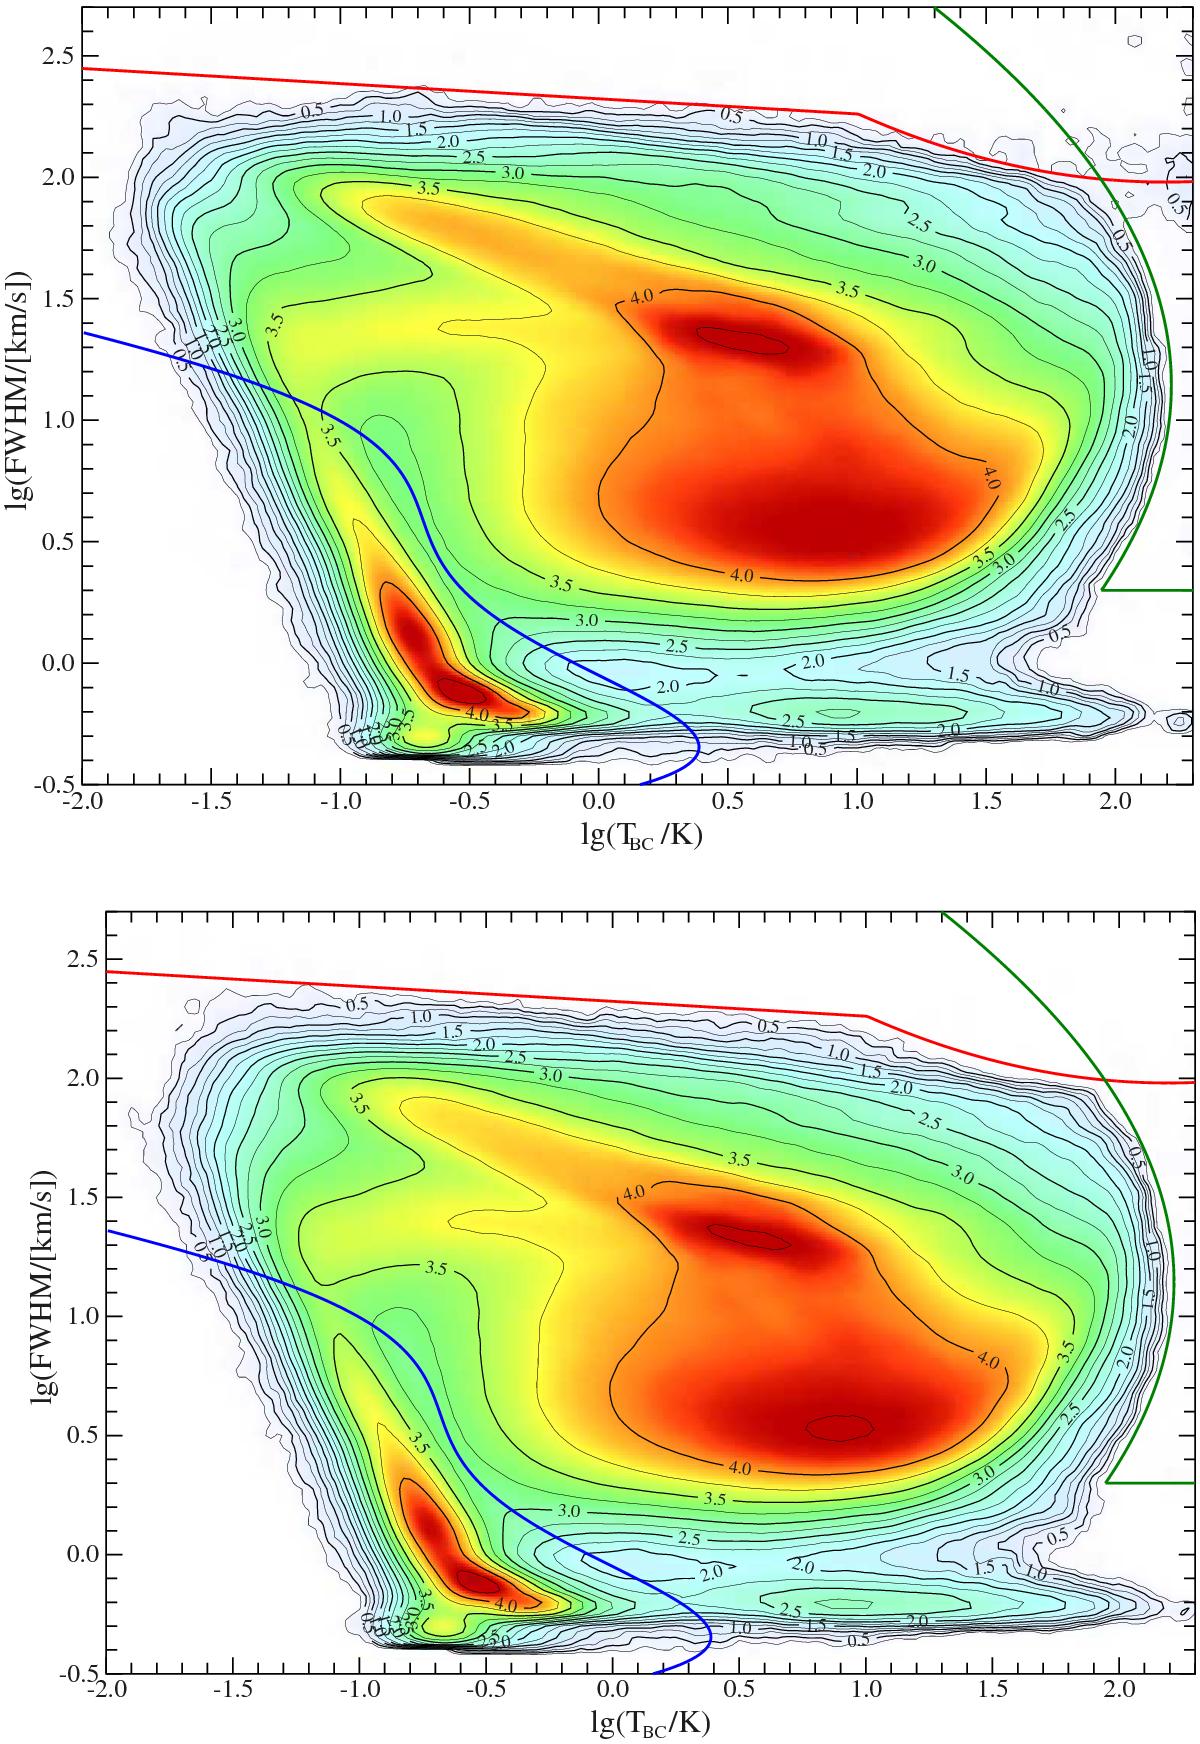
Distribution of the Gaussians in the (lg(TBC),lg(FWHM)) plane. The upper panel is for the first and the lower is for the final iteration of the profile improvement. Isodensity lines are drawn in the scale of lg(N + 1) with the interval of 0.25. The thick lines indicate the selection criteria used in the final iteration.
Current usage metrics show cumulative count of Article Views (full-text article views including HTML views, PDF and ePub downloads, according to the available data) and Abstracts Views on Vision4Press platform.
Data correspond to usage on the plateform after 2015. The current usage metrics is available 48-96 hours after online publication and is updated daily on week days.
Initial download of the metrics may take a while.