Fig. 6
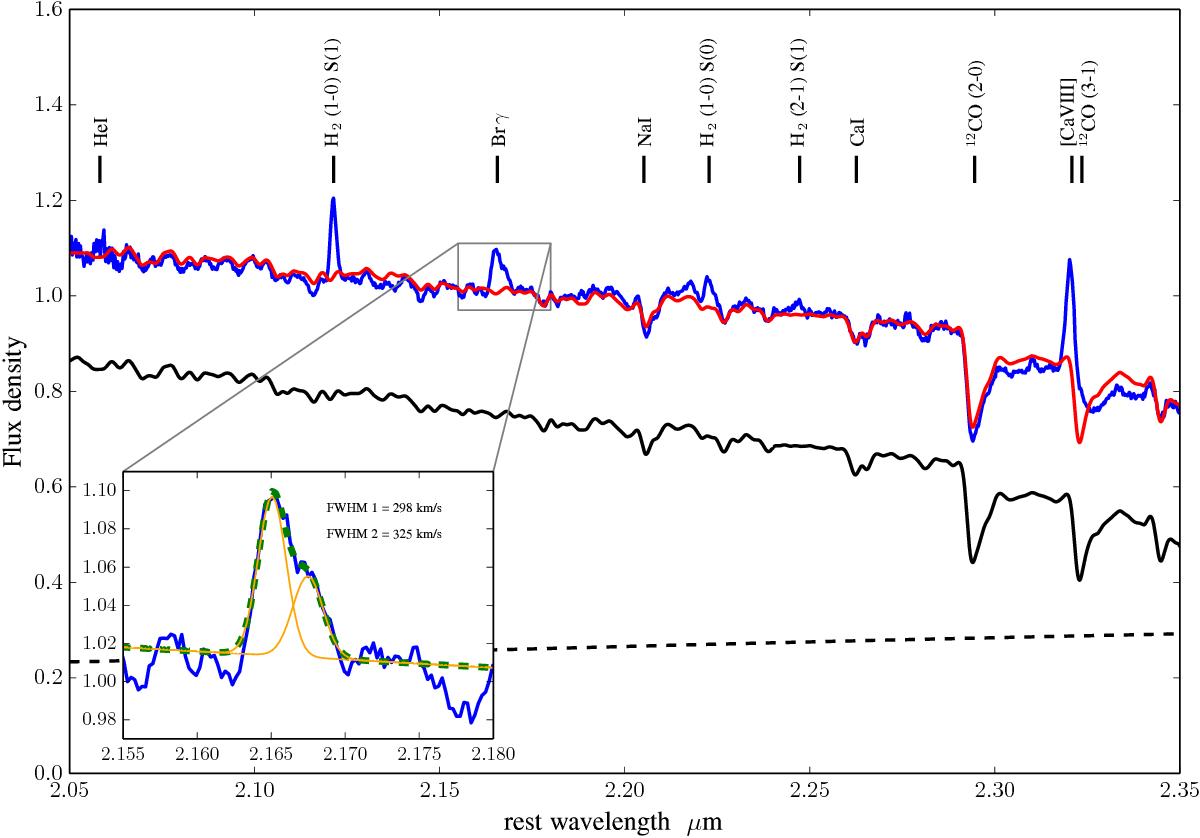
Fit to the nuclear (aperture 1′′) spectrum of NGC 1386. The observed spectrum is shown in blue, the continuum (T = 982 K) and stellar template (HD 176617) are shown as dashed and straight black lines respectively and the total fit is shown in red. Prominent AGN emission lines and stellar absorption features are marked. In the inset we show our two-Gaussian fit to the hBrγ line of NGC 1386, demonstrating that the previously found broad line is actually a superposition of two narrow lines.
Current usage metrics show cumulative count of Article Views (full-text article views including HTML views, PDF and ePub downloads, according to the available data) and Abstracts Views on Vision4Press platform.
Data correspond to usage on the plateform after 2015. The current usage metrics is available 48-96 hours after online publication and is updated daily on week days.
Initial download of the metrics may take a while.