Fig. 4
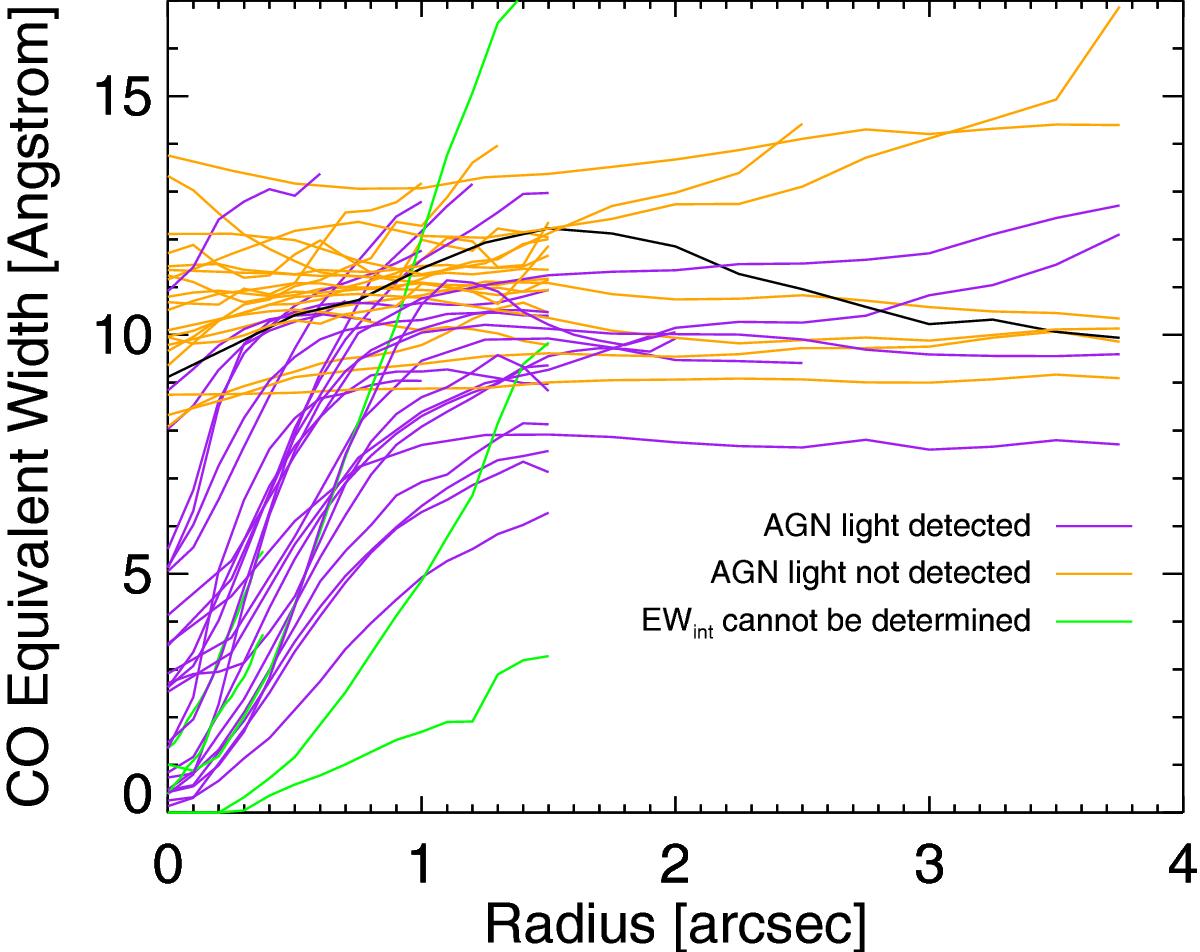
EW averaged in annuli for all 51 sources. Only the good signal/noise part of the cube that was used to fit the EW profile is shown. Diluted sources are drawn in purple, undiluted in orange and sources where the intrinsic value could not be determined due to the limited field of view of the SINFONI data are shown in green. The black line denotes NGC 5135 which has a non-axisymmetric EW profile. This graph shows sources observed in all three SINFONI pixel scales (field of view: 0.8, 3 and 8 arcsec).
Current usage metrics show cumulative count of Article Views (full-text article views including HTML views, PDF and ePub downloads, according to the available data) and Abstracts Views on Vision4Press platform.
Data correspond to usage on the plateform after 2015. The current usage metrics is available 48-96 hours after online publication and is updated daily on week days.
Initial download of the metrics may take a while.