Free Access
Fig. 13
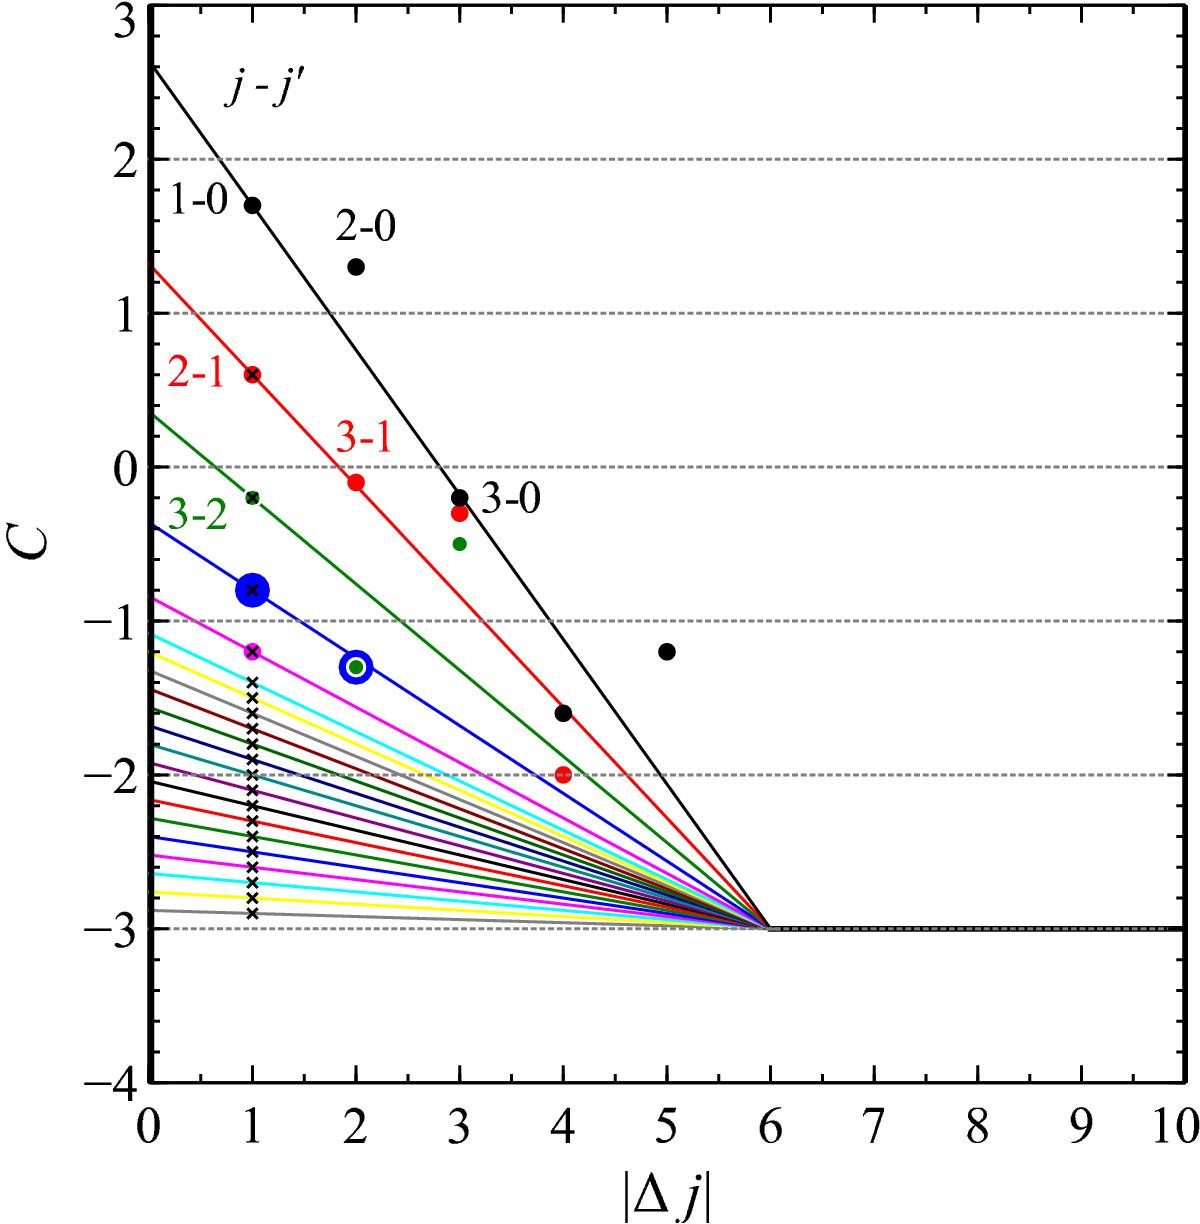
Phenomological constant C as a function of | Δj |. As a result of the linear decrease of C with j′ and the convergence around | Δj | = 6 and C = −3, the slope and y-intercept can be obtained for each transition and the value of C can be predicted. Symbols and fit lines are for j′ = 0 − 4, same as in Fig. 12.
Current usage metrics show cumulative count of Article Views (full-text article views including HTML views, PDF and ePub downloads, according to the available data) and Abstracts Views on Vision4Press platform.
Data correspond to usage on the plateform after 2015. The current usage metrics is available 48-96 hours after online publication and is updated daily on week days.
Initial download of the metrics may take a while.